 Property
You have somewhere between $77,500 and $94,000 sitting in cash, a lender that wants 25% down on an investment loan, and a state that keeps looking safe: the Twin Cities have under three months of supply, Duluth homes sold in a median 15 days, and prices there have barely moved this year. Then you run the monthly math at today's rate and every one of the four biggest markets loses money: Minneapolis about $1,061 a month, St. Paul $849, Duluth $838 and Rochester $1,120.
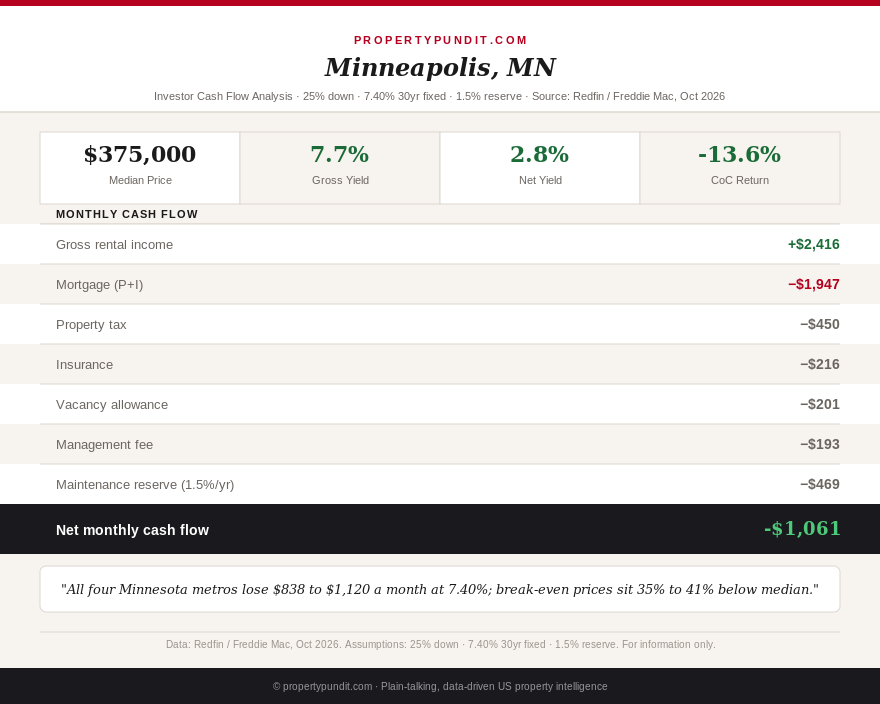
This is our third pass on Minnesota, after the June 11 first pass and the August 4 second pass. The benchmark 30-year rate went from 6.66% to 7.40% in that stretch (Freddie Mac, July 30 and October 8, 2026), the seventh straight weekly rise. I underwrote each city with 25% down, an 8% management fee, one month of vacancy a year and a 1.5% annual maintenance reserve, the same method as Friday's Michigan update. The August pass had no maintenance reserve, so I recomputed its inputs before comparing.
Three inputs are carried, not refreshed: the non-homestead tax rates (county homestead rates plus the 1.25% class-rate multiplier, my estimate, not a published figure), the Duluth insurance line (the statewide average, because Duluth isn't listed), and the Minneapolis rent, which comes from a Rentometer reading dated December 25, 2025. I flag each one where it matters.
Get this in your inbox every Friday.
One email. The number that matters and what it means for you.
Minnesota is still tight, which is why the cash flow fails
The statewide median sale price was $370,000 in August 2026, up 2.8%, with more than 20,000 homes for sale, a seven-year high, and 3.5 months of supply (Minnesota Realtors via Fox 9, September 16, 2026). The seven-county Twin Cities median was $405,000, up 1.3%, with homes closing at 98.2% of list on an average 45 days. In July the metro had just 2.9 months of supply, under half the 5 to 6 months that marks a balanced market (Minnesota Realtors, July 2026). St. Paul-area sales fell 12.6% in August while Minneapolis fell 1.6%, so demand is cooling at the margin without the price cuts you see in Denver or Boston.
Tight supply is good for the price you eventually sell at and bad for the price you pay going in. You're paying prices that sit well above what local rents support (the break-even prices are below), in a market where sellers still hold their price.
What it means for you: Minnesota is a market where the hold, not the first month, pays you, so decide whether you can carry $10,000 to $13,000 a year before you look at a listing.
Four Minnesota rentals, one table
| Monthly line item | Minneapolis | St. Paul | Duluth | Rochester |
|---|---|---|---|---|
| Price (Redfin median, 3 months to Aug 2026) | $375,000 | $315,000 | $310,000 | $359,662 |
| Down payment (25%) | $93,750 | $78,750 | $77,500 | $89,916 |
| Rent (3BR house) | $2,416 | $2,150 | $2,032 | $2,120 |
| Principal and interest (7.40%) | $1,947 | $1,636 | $1,610 | $1,868 |
| Property tax (non-homestead estimate) | $450 (1.44%) | $396 (1.51%) | $333 (1.29%) | $399 (1.33%) |
| Insurance (MoneyGeek) | $216 | $222 | $208 | $178 |
| Management (8%) | $193 | $172 | $163 | $170 |
| Vacancy (one month a year) | $201 | $179 | $169 | $177 |
| Maintenance reserve (1.5% a year) | $469 | $394 | $388 | $450 |
| Net monthly cash flow | -$1,061 | -$849 | -$838 | -$1,120 |
| Cash-on-cash return | -13.6% | -12.9% | -13.0% | -14.9% |
| Coverage ratio (rent / PITIA) | 0.92 | 0.95 | 0.94 | 0.87 |
| Rent needed to break even | $3,684 | $3,165 | $3,034 | $3,459 |
Lines are rounded individually, so they can differ from the total by a dollar. Prices are Redfin medians for the three months ending August 2026: Minneapolis up 5.6%, St. Paul flat, Duluth up 5.0% and Rochester down 0.1%. Rents are Rentometer three-bedroom house averages: Minneapolis $2,416 (December 25, 2025), St. Paul about $2,150 (October 11, 2026, from a $2,100 to $2,200 range), Duluth $2,032 (January 9, 2026) and Rochester $2,120 (January 10, 2026). Insurance is MoneyGeek's city average for a $250,000 dwelling with a $1,000 deductible (updated October 9, 2026); Duluth uses the $2,492 state average.
No Minnesota market clears 1.0 on the coverage ratio, which is the test most DSCR lenders apply; see our DSCR loan guide for why a passing ratio and positive cash flow are separate tests. Here you fail both.
What it means for you: if your lender quotes a coverage ratio under 1.0, you're looking at a bigger down payment or a rate premium before you've paid a dollar of operating cost.
Minneapolis: $1,061 a month, backed by 5.6% appreciation
Redfin shows a $375,000 median sale price for the three months ending August 2026, up 5.6%, with 1,506 homes sold in August (up 5.2%), a median 23 days on market and a 100.4% sale-to-list ratio. 32.1% of homes had a price drop, up 3.2 points (Redfin, August 2026). On $93,750 down, principal and interest is $1,947, the non-homestead tax about $450 and insurance $216, for $2,613 of PITIA against $2,416 of rent. Management, vacancy and the reserve take another $863, so you pay $12,729 a year to own it.
Here is the counterweight. If Minneapolis prices rise at last year's 5.6% pace, the $375,000 house gains about $21,000 in a year, more than the $12,729 cash loss. That's a real argument for holding, with three caveats: a 3-month median can swing on which houses sold, selling costs take 6% to 8% of the gain, and appreciation isn't a forecast. The Rentometer rent is also nine months old. At $2,566 the loss falls to $935; at $2,266 it grows to $1,186.
What it means for you: Minneapolis works as an appreciation bet you can fund from salary, and the math points toward a smaller, cheaper house before it points toward a bigger down payment.
St. Paul: closest to breakeven, with a rent cap and flat prices
St. Paul is the lowest-priced Twin Cities option at $315,000, flat from a year ago, and Redfin scores it 82 out of 100 on competitiveness with homes at 100.6% of list, 44.3% of them above asking (Redfin, August 2026). At $2,150 of rent the loss is $849 a month, or $10,186 a year on $78,750 down. Break-even rent is $3,165, which is 47% above what a three-bedroom house earns.
Two things work against you here that don't show in the table. St. Paul's rent stabilization ordinance caps most annual increases at 3% (about $64 a month on $2,150), with a justification process for larger ones; a May 2025 amendment exempted new construction (City of St. Paul). Most entry-level houses are older stock, so the cap applies to you. And flat prices mean the 5.6% cushion that helps in Minneapolis doesn't exist: the $10,186 annual loss is 3.2% of the price, against 0.0% appreciation.
What it means for you: skip St. Paul unless you can buy well below the $315,000 median, because the rent cap closes the one path out of a loss, which is raising rent.
Duluth and Rochester: cheapest to carry, priciest to carry
Duluth has the smallest loss at $838 a month. Redfin shows a $310,000 median for the three months ending August 2026, up 5.0%, with 393 homes sold in August (up from 317), a median 15 days on market and a 100.4% sale-to-list ratio. Rent of $2,032 against $2,151 of PITIA gives a 0.94 coverage ratio. A 5.0% gain would add $15,500 to value against a $10,057 annual loss, so Duluth, like Minneapolis, pencils as an appreciation hold. The insurance line is the statewide $2,492 average, and Lake Superior's weather makes a real quote worth getting before you offer.
Rochester is the weakest of the four at $1,120 a month. The $359,662 median is flat (down 0.1%), 570 homes sold in August (down 1.7%), and 40.1% had price drops, up 12.3 points (Redfin, August 2026). Mayo Clinic demand holds up rents, but $2,120 of rent against a price that high leaves a 0.87 coverage ratio, the lowest in the state, and no appreciation to offset the $13,441 annual loss. In the August pass Rochester already stood out as the one outright failure; it still does.
What it means for you: Duluth is the cheaper way to own Minnesota exposure, and Rochester is the one to cross off unless you buy about 40% under the median.
What changed since August: method, then rate, then inputs
The August pass reported -$105, -$39, -$114 and -$414. Those numbers used 6.66% and no maintenance reserve, so the honest comparison starts by putting August's inputs through today's method.
| Net monthly cash flow | Minneapolis | St. Paul | Duluth | Rochester |
|---|---|---|---|---|
| Published in August (6.66%, no reserve) | -$105 | -$39 | -$114 | -$414 |
| Same inputs, today's method (adds reserve, 1 month vacancy) | -$657 | -$501 | -$549 | -$928 |
| Same inputs at 7.40% | -$793 | -$614 | -$658 | -$1,059 |
| Today's prices, rents, insurance | -$1,061 | -$849 | -$838 | -$1,120 |
The maintenance reserve and the vacancy convention explain the largest share of the drop, between $435 and $552 a month. The rate move to 7.40% explains only $109 to $136. The last step is input changes: Minneapolis insurance rose to $216 a month from the $137 August estimate and its rent fell to $2,416 from a $2,550 estimate, so part of that gap is a source change, not a market move. If you read a Minnesota deal from the summer, recompute it with a repair reserve before you trust it.
What it means for you: when a deal's numbers got worse, find out which input moved before you blame the Fed, because the reserve you skipped usually costs more than the rate.
What would make a Minnesota rental work
At 7.40% with the same costs, break-even prices are about $236,000 in Minneapolis, $205,000 in St. Paul, $199,000 in Duluth and $211,000 in Rochester, which is 35% to 41% below each median. A rate of 6.00% helps by $216 to $261 a month but still leaves Minneapolis at -$800, St. Paul at -$630, Duluth at -$622 and Rochester at -$870. So rates alone won't rescue these deals; price or rent has to move.
Taxes sit on top. Minnesota taxes non-homestead residential property at a 1.25% class rate against 1.00% on the first $500,000 of an owner-occupied home, so a listing's tax history, which reflects the seller's homestead rate, understates your bill by roughly 20% to 25% (Minnesota Department of Revenue, 2026 class rates). State income tax on rental profit runs 5.35% to 9.85% (Minnesota Department of Revenue, 2026 brackets), but that only bites if the property earns a profit. See the Wichita duplex comparison for another case where solving for break-even price was more useful than guessing a listing.
What it means for you: the honest offer in Minnesota is a break-even offer, and the useful move is to sit on a pre-approval and wait for a seller who needs out.
Frequently asked questions
Is Minnesota a good state for rental property cash flow in 2026?
Not at 7.40%. With 25% down, an 8% management fee, one month of vacancy and a 1.5% maintenance reserve, all four of the state's largest markets lose $838 to $1,120 a month. Duluth and Minneapolis at least carry 5.0% to 5.6% recent appreciation, which could cover the loss.
How much higher is Minnesota property tax on a rental?
The non-homestead class rate is 1.25% of value against 1.00% on the first $500,000 of an owner-occupied home. After local levies that's roughly 20% to 25% more tax than the seller paid.
What price would make a Minnesota rental break even?
About $236,000 in Minneapolis, $205,000 in St. Paul, $199,000 in Duluth and $211,000 in Rochester at 7.40%, using the rents in the table.
Does St. Paul have rent control?
Yes. St. Paul's ordinance caps most annual rent increases at 3%, with a justification process for exceptions, and exempts new construction after a May 2025 amendment. Minneapolis has no citywide cap.
For a wider view of where rentals do pencil, the county yield map ranks markets by gross yield.