 Property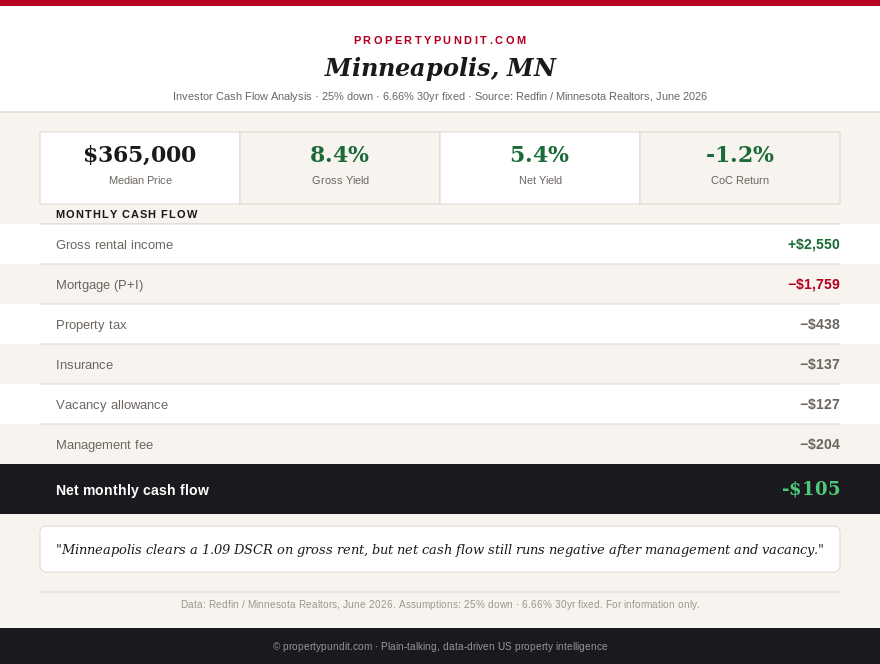
You pull up two headlines about Minnesota real estate in the same week and they seem to contradict each other. One says active listings just hit their highest level in seven years, the kind of number that should hand buyers and investors real bargaining power. The other says the Twin Cities metro is still, by the textbook definition, a seller's market. Both are true at the same time, and untangling why matters more than either number does on its own if you're trying to figure out whether Minnesota actually pencils out as a rental market in 2026.
Minnesota's statewide median sale price rose 1.4% year over year to $375,000 in June 2026, with 19,008 homes for sale statewide, up 7.5% from a year earlier, a seven-year inventory high (Minnesota Realtors, June 2026 report). In the Twin Cities specifically, the Minneapolis Area Realtors report puts the metro median at $410,000, up 2.1% year over year, a different geography and a meaningfully different price point than the statewide figure. Always check which one you're looking at before comparing Minnesota to another state's numbers; the two figures answer different questions.
The inventory paradox: more homes for sale, still a seller's market
Here's the part that trips up anyone reading the headline number in isolation. Nationally, 4.6 months of supply defines a roughly balanced-to-buyer's market, and most of this site's recent state coverage has documented buyer negotiating room growing almost everywhere. The Twin Cities metro posted just 2.8 months of supply in June 2026, up 3.7% from a year earlier but still less than half the national balanced threshold, with homes selling in an average of 42 days and receiving 99.6% of asking price (Minneapolis Area Realtors, June 2026). Statewide, the average was 49 days on market at 98.8% of asking.
New listings are simply being absorbed almost as fast as they arrive: pending sales rose 9.7% year over year in the Twin Cities and 8% statewide in the same report, which is why a genuine inventory increase hasn't translated into the kind of negotiating room buyers are finding in most other states covered on this site this summer. If you're underwriting a Minnesota purchase expecting the same seller concessions showing up in the national data, you're pricing this market wrong; sellers here still have the upper hand on offer terms, even if the headline inventory number suggests otherwise.
Get this in your inbox every Friday.
One email. The number that matters and what it means for you.
Underwriting the four markets: Minneapolis, St. Paul, Duluth, Rochester
Running the same 25%-down, 6.66% 30-year fixed DSCR model used across this site's state coverage against single-family rental comps in each market tells a more specific story than the state-level headline can. Minneapolis at a $365,000 median (Redfin, three months ending May 2026) with an estimated single-family rent near $2,550 produces a monthly PITIA near $2,334, a DSCR of 1.09, and a net cash flow of about -$105 a month after an 8% management and 5% vacancy allowance. St. Paul, at a lower $304,000 median (Redfin) against roughly $2,200 in typical single-family rent, actually comes closest to breakeven of the four: PITIA near $1,962, DSCR 1.12, net cash flow around -$39 a month, the smallest gap on the list.
Duluth, at $290,000 with an estimated $1,950 in rent, posts a DSCR of 1.07 and net cash flow near -$114 a month. Rochester is the outlier: at a $350,000 median (Redfin, up 6.3% year over year, the fastest-appreciating of the four) against an estimated $2,050 in rent, PITIA runs about $2,206, producing a DSCR of just 0.93, the only one of the four markets that fails the 1.0 minimum most DSCR lenders require outright, and a net cash flow near -$414 a month. Mayo Clinic's employment base keeps demand, and therefore prices, elevated in Rochester, but rents haven't kept pace with that appreciation, the same decoupling pattern this site has already documented in Utah's Silicon Slopes corridor and Idaho's Boise-area transplant boom. If you're underwriting Rochester specifically because of the Mayo Clinic employment thesis, model the rent growth separately from the price growth; right now, they're moving at different speeds.
The non-homestead tax trap that changes the math further
None of the DSCR figures above yet account for the fact that Minnesota taxes rental property differently than owner-occupied property. The state's non-homestead residential class rate is a flat 1.25% of market value, compared to a homestead owner-occupant's tiered 1.00% on the first $500,000 rising to 1.25% above that threshold. On every property in this analysis, all priced under $500,000, that difference means an investor's effective property tax bill runs roughly 20-25% higher than what an owner-occupant would pay on the identical home once the local county and city levy is applied on top of the class rate. Applying that differential to each county's published homestead effective rate puts Hennepin County (Minneapolis) non-homestead property tax near 1.44%, Ramsey County (St. Paul) near 1.51%, St. Louis County (Duluth) near 1.29%, and Olmsted County (Rochester) near 1.33%, all already built into the PITIA figures above. Anyone pulling a Minnesota listing's advertised tax history should assume it reflects the seller's homestead rate, not the higher bill a new investor-owner will actually receive.
St. Paul's rent cap: a real constraint, but a narrower one than it sounds
St. Paul is the one market on this list carrying a genuine regulatory ceiling on rental income: its Rent Stabilization Ordinance, approved by voters in 2021, caps most annual rent increases at 3%, with landlords able to self-certify an exception up to 8% or apply for more with written justification. A May 2025 city council amendment permanently exempted new construction and anything built after 2004, which matters because it means the cap primarily targets St. Paul's older housing stock, and a sub-$304,000 single-family rental in St. Paul is overwhelmingly likely to be pre-2004 construction. Minneapolis carries no equivalent citywide rent cap, so the same purchase price and rent assumptions in Minneapolis don't carry this specific appreciation-on-rent ceiling. Weigh St. Paul's better near-term cash flow against a capped upside on future rent growth before assuming it's the obvious pick between the two Twin Cities.
Why the appreciation case still holds even when cash flow doesn't
Minnesota's employer base is a genuine differentiator from most Midwest states already covered on this site: three Fortune 500 headquarters sit in the Twin Cities alone (UnitedHealth Group, Target, and U.S. Bancorp), Mayo Clinic anchors Rochester with one of the most stable healthcare employment bases in the country, and 3M and General Mills add further diversification beyond a single dominant industry. That's a meaningfully broader job base than several states this site has flagged as single-catalyst appreciation stories, and it helps explain why Twin Cities inventory keeps getting absorbed even at a 7-year-high listing count. None of that shows up in a DSCR spreadsheet, but it's the difference between a market where negative day-one cash flow is a temporary bridge to equity gains and one where it's a standalone risk with no underlying demand story to support it.
The tradeoff is that none of this appreciation thesis rescues the numbers if you need income now rather than in five to seven years. A -$105-a-month Minneapolis property or a -$414-a-month Rochester property both require reserves to carry through any vacancy, repair, or rate environment that doesn't improve as quickly as you're modeling. Model your own hold period and required reserve cushion explicitly before treating the appreciation case as a substitute for actual cash flow; the two are not interchangeable risks.
What this means for an investor weighing Minnesota against a no-income-tax state
Minnesota's graduated income tax runs from 5.35% up to 9.85% on income above $193,240 for single filers in 2026, and rental income is taxed as ordinary income under the same brackets, a real cost for anyone comparing Minnesota to a neighboring state or a no-income-tax market elsewhere in the country. Combined with the non-homestead property tax penalty and none of the four major markets clearing positive cash flow after real operating costs, Minnesota in 2026 reads less like a cash-flow play and more like an appreciation-and-equity thesis, similar to the pattern already documented in Iowa, another Midwest market where DSCR underwriting comes up short even as the underlying real estate holds up. The math points toward treating Minnesota, and St. Paul specifically, as a long-hold equity-building purchase rather than a day-one cash-flow deal, and toward running your own DSCR qualification math before assuming the state's low crime and strong employer base translate automatically into rental profitability.
Frankly, if immediate cash flow is the priority rather than long-term appreciation, most investors who run these numbers end up looking at markets in this site's county-level yield map with a lower entry price relative to rent than any of Minnesota's four largest metros currently offer. Minnesota's case is real, it's just a different case than a cash-flow spreadsheet is built to make.