 Property
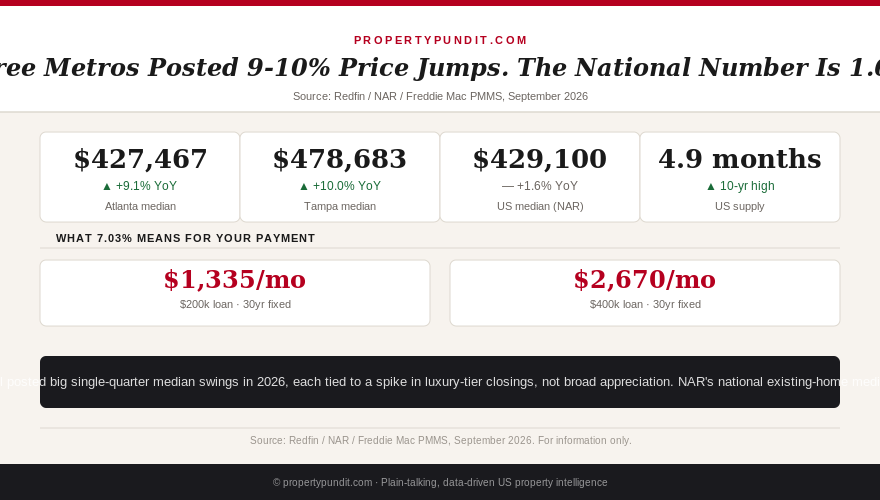
Atlanta's median home price jumped 9.1% year over year in August 2026, according to Redfin, a sharp reversal from the 4.7% year-over-year decline this site logged for the exact same city just three months earlier. That's not a typo, and it isn't a sudden turnaround in buyer demand either. It's the same statistical move that hit Tampa (+10.0% year over year, also August 2026) and Pittsburgh (+9.1%, June 2026) this year: a spike in luxury-tier closings pulling the median up while the price of an ordinary house barely budged.
If you live in one of those metros and just watched local news lead with a scary double-digit price jump, the instinct is to panic. Did you just miss your window? Are homes suddenly further out of reach? Almost certainly not, and the reason comes down to what a "median" price actually measures, and what it doesn't.
This pattern has now shown up three times in six months across markets this site tracks closely enough to catch it, which is enough to stop treating it as a one-off and start teaching readers how to check for it themselves before a scary headline changes a decision it shouldn't.
Get this in your inbox every Friday.
One email. The number that matters and what it means for you.
Redfin's own reporting on the metros posting the largest year-over-year gains points to the same mechanism: a roughly 23% year-over-year jump in luxury closed sales in the highest-gaining cities, concentrated in a relatively small number of transactions that can still move a median. A median only cares about which sale lands in the middle of the sorted list that month, not how many sales happened at any given price.
Three cities, the same six-month story
Pittsburgh was first. This site flagged its 9.1% year-over-year jump back in July 2026 (Redfin, June 2026 reading) while comparing the city to Cleveland for a first-time buyer, and even then the caveat was necessary: median-price appreciation that size, in a market where an entry-level home was still trading in the low $200,000s, didn't match what buyers in that price band were actually seeing.
Tampa was second. Its median hit $478,683 in August 2026, up 10.0% year over year, the largest single-quarter swing of any Florida metro this site reviewed in its most recent statewide investor pass.
Atlanta is the third, and the most dramatic: a metro that was down 4.7% year over year as recently as May 2026 posted a 9.1% year-over-year gain by August, a nearly 14-point swing in three months, a reversal this site also flagged in its third Georgia investor pass. Three cases in six months is enough to call this a pattern, not a coincidence, and the mechanism behind all three is the same: closings shifted toward the top of the market, and the median followed them up. If your city just posted a headline number like this, the first question worth asking isn't "did I miss it?" It's "which houses actually sold?"
Translate the headline into a mortgage payment and the panic shrinks fast. Reverse Atlanta's 9.1% jump and last year's implied median works out to about $391,800. At 20% down and 7.03%, financing today's $427,467 median costs roughly $190 a month more in principal and interest than financing that implied prior-year figure, real money, but a long way from what a scary double-digit headline suggests, and nowhere near what the buyer who just financed a luxury closing actually spent.
What a median actually measures
A median home price is the sale that lands exactly in the middle when every closing that month is sorted from cheapest to most expensive. It's a useful number precisely because, unlike an average, a single $5 million mansion sale can't drag it around on its own. But it has a real weakness: it only tells you about the composition of what closed, not about what any individual home is worth.
Here's a simplified illustration of the mechanism, not a real market: imagine a metro that normally closes 100 home sales a month, clustered between $250,000 and $350,000, with a median around $300,000. One month, a new luxury development finishes and adds 15 closings above $700,000 to that month's total, on top of the usual 85 ordinary sales still trading near $300,000. None of those 85 ordinary homes changed in value. But the mix of what closed did, and the median, the sale sitting in the middle of a now more top-heavy distribution, moves up with it. Multiply that by a metro with a genuinely large luxury development, a wave of estate sales, or a run of high-end new construction closing in the same quarter, and you get exactly the kind of swing Atlanta, Tampa, and Pittsburgh all posted.
This is also why the data providers who publish a median almost always publish an average alongside it, and why a wide gap opening up between the two (the average rising faster than the median) is one of the clearest tells that luxury sales are doing the work, a check that takes less time than reading the headline that scared you in the first place.
How to check this before you panic (or get excited)
You don't need a statistics degree to catch this, and you don't need to wait for a site like this one to flag it for you. Three checks, in order of how fast they work: first, compare the median to the average for the same metro and month, since most sources that publish one publish the other, and a gap opening up between them is the luxury-skew signal on its own. Second, look at days on market and sale-to-list ratio for your specific price band, not the metro headline. A market where $300,000 entry-level homes are sitting for 45 days and selling 2% under asking is not the same market as one where $700,000 estates are getting bidding wars, even if they share a ZIP code. Third, check whether the local Realtor board or Redfin's data center calls out a change in the mix of what sold. Luxury share, new-construction share, and cash-buyer share all move independently of "prices," and a metro where luxury sales jumped from 3% to 10% of closings in a single quarter just told you exactly where its median move came from. Fourth, and easiest of all: ask your own agent or lender what a comparable home to yours actually closed for in the last 30 days, not what the metro-wide press release said. A single real comp in your price band beats a headline every time.
What's actually happening nationally
Zoom out, and the national picture looks nothing like Atlanta's, Tampa's, or Pittsburgh's headlines. NAR's existing-home sales report for August 2026 put the national median at $429,100, up just 1.6% year over year, a fraction of what any of these three metros posted. Supply sat at 4.9 months, the highest reading in more than a decade, the data-driven opposite of a market where buyers should feel like the door is closing. Mortgage rates, meanwhile, climbed to 7.03% on Freddie Mac's most recent weekly survey (PMMS, September 24, 2026), up from 6.95% the week before, which is a real affordability headwind, but it's a separate story from a local median jumping 9% or 10% in a single quarter. Conflating the two, rates are up and my city's median is up so I've definitely been priced out, is exactly the kind of panic this pattern is designed to trigger, and exactly the kind worth checking against the actual data for your price band before you act on it. If the down payment side of the math is what's worrying you more than the headline price, our breakdown of what down payment size actually gets you is worth reading before you assume either number applies to your situation.
What this means for you
If you're shopping in one of these markets right now, the math points toward ignoring the metro-wide headline entirely and pulling the median, average, and days-on-market figures for the specific price band and neighborhood you're actually looking at. Most Realtor board and Redfin data lets you filter down that far for free. If the entry-level segment you're targeting shows a modest, single-digit move and a normal time on market, you weren't priced out by a luxury wave you were never competing in. And if you're a seller wondering whether now is the moment to list based on a scary-big local number, the honest answer is the same: check what's actually happening in your own price band, because a metro-wide median swing driven by a few dozen high-end closings tells you very little about what your particular house will fetch. Most readers who run this check end up finding the "crisis" was never really about the home they wanted in the first place.