 Property
In August you ran Pennsylvania and found one pocket that still paid you to own it: a sub-$200,000 house in suburban Allegheny County at +$109 a month. Since then the 30-year rate has gone from 6.65% to 7.24%, and the question you're carrying into the fourth quarter is whether that last positive number survived. It did, barely. Pittsburgh and Philadelphia did not, and both slid further into the red.
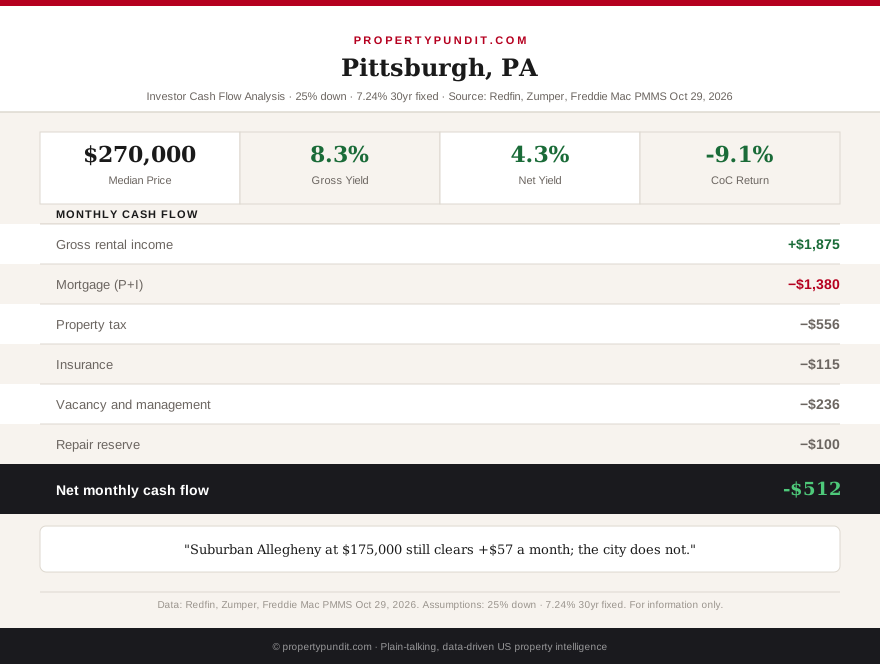
This is the third pass on Pennsylvania. The August Pennsylvania spotlight found Pittsburgh and Philadelphia converging at roughly -$420 a month despite a 1.1-point gap in tax rates. This pass changes one input: the rate. Freddie Mac's 30-year fixed averaged 7.24% for the week ending October 29, 2026 (Freddie Mac PMMS), against 6.65% on August 20. Prices, rents and tax rates are the latest verified figures from the August pass (Redfin 3-month averages ending June 2026; Zumper and Rentometer house rents, 2026), not new readings.
Get this in your inbox every Friday.
One email. The number that matters and what it means for you.
Pennsylvania at 7.24%: two cities lose, one pocket survives
Same assumptions as August: 25% down, a 30-year fixed loan, vacancy and management taken out of rent (effective rent is 87.4% of the asking rent), a $100 monthly repair reserve, and the same tax and insurance lines. Only the rate moved. Cash flow is effective rent minus the full payment and the reserve; DSCR is gross rent divided by the full payment, the way lenders count it.
| Market | Price | P&I/mo | PITI/mo | Eff. rent/mo | Cash flow | DSCR | vs August |
|---|---|---|---|---|---|---|---|
| Pittsburgh city | $270,000 | $1,380 | $2,051 | $1,639 | -$512 | 0.91 | -$80 |
| Philadelphia | $300,000 | $1,533 | $2,023 | $1,617 | -$506 | 0.91 | -$88 |
| Suburban Allegheny | $175,000 | $894 | $1,198 | $1,355 | +$57 | 1.29 | -$52 |
The 0.59-point rate rise added about $80 to $90 a month to the two city payments and $52 to the suburban one, and it added nothing to rent. Both cities now sit at a 0.91 coverage ratio, below the 1.0 line and well below the 1.25 many DSCR lenders ask for. The suburban house still clears 1.0 but fell from 1.35 to 1.29, which is the thinnest cushion it has had since we began tracking it.
So if you're an investor who kept Pennsylvania on the list because of that suburban number, you're still in, but your margin for a single vacant month or a $2,000 roof repair is smaller than it was in August.
What it takes to fix Pittsburgh: every lever on one house
Here is what has to change on a $270,000 Pittsburgh house with $1,875 gross rent before the monthly number reaches zero. Each row changes one input and holds the rest at the table's assumptions.
| Change one thing | Pittsburgh cash flow |
|---|---|
| As is: 25% down at 7.24% | -$512 |
| 40% down | -$236 |
| 50% down | -$52 |
| 60% down | +$132 |
| Price falls to about $199,000 (down 26%) | $0 |
| Gross rent rises to about $2,461 (up 31%) | $0 |
| Rate falls to about 3.1% | $0 |
Pittsburgh needs about 53% down to turn positive, and at 50% down it still loses $52. Philadelphia is a shade easier because its tax bill is lower: at 50% down it earns +$5 a month, which is not a profit so much as a rounding error. Either way, you're putting $135,000 to $150,000 of your own cash into a house that returns nothing, which is a bet on appreciation, not on income.
That means a financed purchase in either city only works if you're willing to treat it as a growth holding and accept a monthly check you write instead of receive.
Why the tax gap between the two cities stopped mattering
Pittsburgh's effective property tax rate is 2.47% inside the city and 1.39% in the suburbs, after Allegheny County Council passed a 36% millage increase (4.73 to 6.43 mills) in December 2025 (Allegheny County, December 2025). Philadelphia's combined rate is 1.3998% (City 0.6159% plus School 0.7839%) for the 2025-2026 tax year (City of Philadelphia). On paper that's a 1.07-point advantage for Philadelphia, worth about $206 a month on these prices.
It gets spent on the other side of the ledger. Philadelphia's median is $30,000 higher, so its principal and interest is $153 higher, and its rent is $25 lower. The tax advantage is real, but a higher price and a flat rent absorb most of it, which is why the two cities land within $6 of each other. Philadelphia also adds a 3.44% Net Profits Tax on rental income earned in the city by non-residents (City of Philadelphia, 2026), and Pennsylvania's flat 3.07% state income tax applies on top of what survives. Those taxes matter at tax time, but they don't repair a monthly deficit.
If you're comparing the two, stop looking for the cheaper tax rate and look for the cheaper price per dollar of rent, because that's where the money actually goes.
The suburban Allegheny pocket: still positive, less safe
A $175,000 suburban house renting for $1,550 has a $1,198 monthly payment, $1,355 of effective rent, and a +$57 cash flow after the repair reserve. That's a 1.6% cash-on-cash return on $43,750 down, down from 3.0% in August. At 40% down it earns +$236 and at 50% down +$355, which means this is the one Pennsylvania market where adding cash buys you income and not just a lower loss.
The risk is how little room sits between +$57 and zero. A rate move of another 0.65 points, a month of vacancy, or a rent that comes in $75 under the $1,550 estimate erases it. Verify the rent against two or three active listings in the specific school district before you commit, because suburban Allegheny rents vary far more by district than the county average suggests.
So if you're chasing Pennsylvania cash flow, the suburbs are the only version of the plan that works, but treat +$57 as break-even with an upside, not as income.
What a Pennsylvania investor should do now
The math points toward the suburbs or a bigger down payment, not the cities. Frankly, if you have $135,000 to put down on a Pittsburgh house that still loses $52 a month, most investors who run the numbers against the Midwest end up buying where the rent covers the payment on 25% down. The single-family rental yield county map shows which counties do. If you already own in Pittsburgh or Philadelphia, hold on appreciation only if you can carry $500 a month, and compare it with a nearby market in the Pittsburgh vs. Cleveland comparison before you add more.
If you still want Pennsylvania, buy under $200,000 in a suburb, confirm the rent with active listings, and hold a reserve for the month the number goes negative.
Frequently asked questions
Is Pittsburgh a good place to buy a rental property in 2026? At Freddie Mac's 7.24% rate (October 29, 2026), a Pittsburgh house at the $270,000 median with 25% down loses about $512 a month after vacancy, management, taxes, insurance and a repair reserve. It needs roughly 53% down or a price near $199,000 to break even.
Is Philadelphia or Pittsburgh better for rental investors? They are nearly identical at today's prices: Philadelphia loses about $506 a month and Pittsburgh $512, both at a 0.91 coverage ratio. Philadelphia's lower property tax rate is offset by its higher price.
What is Pennsylvania's income tax on rental income? Pennsylvania charges a flat 3.07% state income tax, the lowest flat rate in the Northeast. Philadelphia adds a 3.44% Net Profits Tax on rental income earned in the city by non-residents.
Can I get a DSCR loan for a Pennsylvania rental? In the suburbs, yes: a $175,000 Allegheny house at 25% down has a 1.29 coverage ratio. In Pittsburgh and Philadelphia the ratio is 0.91, below the 1.0 to 1.25 most DSCR lenders want.