 Property
You've probably heard that Philadelphia is the cheaper property tax bill of Pennsylvania's two big cities, and on paper that's true: Philadelphia's effective rate runs about 1.40%, versus roughly 2.47% inside Pittsburgh city limits. If you're deciding between the two purely on tax rate, Philadelphia looks like the clear winner. Run the actual purchase math at today's prices and rates, and that advantage disappears. Pittsburgh loses about $432 a month. Philadelphia loses about $418. A $1.07-point difference in tax rate buys you almost nothing once the rest of each city's numbers are on the table.
This is a second-pass underwrite of Pennsylvania, updating the entry-level suburban Pittsburgh case this site published in June with current city-of-Pittsburgh and Philadelphia numbers, a rate that's moved from 6.47% to 6.65% since, and rents pulled from house-specific listings rather than blended apartment averages. The suburban verdict holds. The two anchor cities now land closer together than either one's tax rate would suggest.
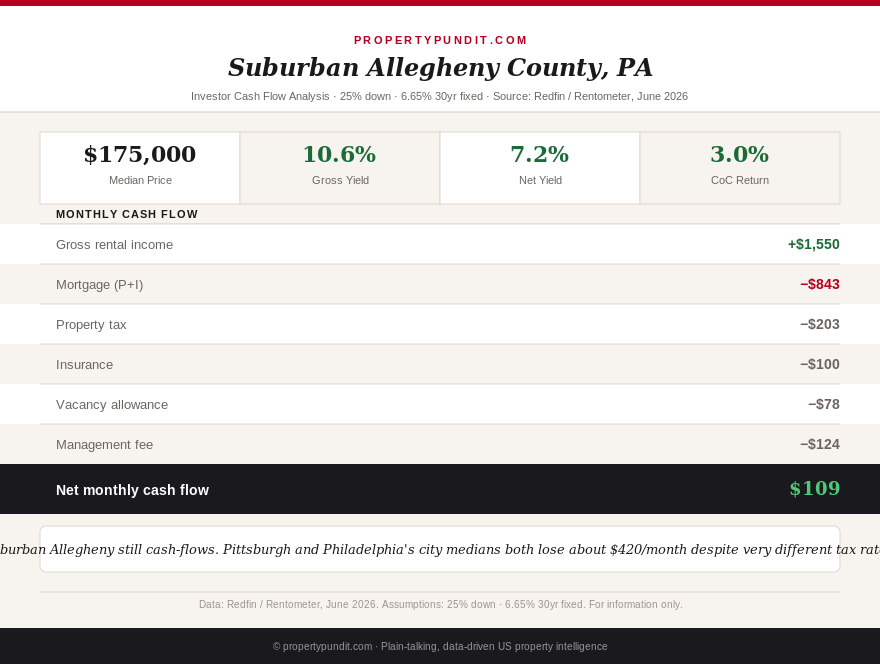
Pennsylvania's statewide median sale price sits at $330,000 as of June 2026, up 1.23% year over year (Redfin). That statewide figure masks two very different city-level stories, and a third market, suburban Allegheny County, that's the only one of the three that still pencils.
Get this in your inbox every Friday.
One email. The number that matters and what it means for you.
Two cities, two completely different tax systems
Pittsburgh and Philadelphia don't just have different tax rates. They run on different assessment logic entirely, and that's worth understanding before you compare a single percentage between them. Allegheny County hasn't done a countywide reassessment since 2012, so assessed values still reflect 2012-era market conditions, adjusted by a common-level ratio to approximate current value. On top of that base, Allegheny County Council passed a 36% millage increase in December 2025, raising the county portion from 4.73 to 6.43 mills, its first hike in over a decade. Combined with Pittsburgh's city millage, Pittsburgh Public Schools' 10.457 mills, and the smaller parks and library levies, City of Pittsburgh investment property carries an effective rate of roughly 2.47%.
Philadelphia works differently. The city reassesses to full current market value on a rolling basis (most recently effective January 1, 2025, with no citywide revaluation planned for 2026), and the combined city-plus-school real estate tax rate is a flat 1.3998% of assessed value. There's no common-level-ratio adjustment layered on top, which is part of why the nominal rate looks so much lower than Pittsburgh's. Philadelphia also levies a 3.44% Net Profits Tax on rental income earned by non-resident landlords, on top of Pennsylvania's 3.07% state income tax, a cost that shows up at tax time rather than in the monthly PITI comparison below.
So what this means for you: don't shop Pennsylvania real estate on advertised tax rate alone. Pittsburgh's higher rate applies to a lower-value base and comes with a state income tax advantage that's clean of any city surcharge. Philadelphia's lower rate applies to full market value and carries an extra local tax on the rental income itself. The two systems partially cancel each other out, which is exactly why the monthly cash flow numbers below land closer together than the headline rates suggest.
The math: Pittsburgh at $270k versus Philadelphia at $300k
Both models below use 6.65% (Freddie Mac PMMS, August 20, 2026), 25% down, 8% property management, 5% vacancy allowance, and a $100/month capex reserve, matching this site's standard investor underwrite.
| Item | Pittsburgh ($270k) | Philadelphia ($300k) |
|---|---|---|
| Loan amount (75% LTV) | $202,500 | $225,000 |
| P&I at 6.65% | $1,300 | $1,444 |
| Property tax | $556 (2.47%) | $350 (1.40%) |
| Insurance | $115 | $140 |
| Total PITI | $1,971 | $1,934 |
| Gross monthly rent (3BR house) | $1,875 | $1,850 |
| Effective rent (8% mgmt, 5% vacancy) | $1,639 | $1,617 |
| Capex reserve | ($100) | ($100) |
| Net cash flow | -$432/month | -$418/month |
| DSCR (effective rent / PITI) | 0.95 | 0.96 |
Pittsburgh's city median comes from Redfin's three-month average ending June 2026 ($270,000, up 1.9% year over year), a meaningful jump from the $231,500 Zillow Home Value Index figure this site cited in June. The two sources measure different things: Zillow's index smooths value across the entire housing stock including homes that haven't recently sold, while Redfin reflects what's actually closing. At today's transaction prices, use the Redfin figure for underwriting a purchase. Philadelphia's median similarly comes from Redfin's three-month average ($300,000, up 5.2% year over year), well below the $378,000 figure this site cited in June from an April Redfin pull, a gap likely driven by which submarkets were transacting in each window rather than a genuine two-month price drop. Always check the current three-month average rather than reusing an older snapshot.
The takeaway for anyone comparing these two cities on a spreadsheet: a $14/month gap between two markets with such different tax structures and price points isn't a meaningful edge either way. Both are essentially equally bad for cash flow at today's median price, and the DSCR gap (0.95 versus 0.96) is too small to change a lender's decision either way.
Why the numbers converge despite such different tax rates
Philadelphia's lower tax rate should, in theory, make it the better cash-flow city. It doesn't, because Philadelphia's higher purchase price and lower rent-to-price ratio absorb the entire tax advantage. At $300,000, Philadelphia's rent of $1,850 works out to a 0.62% gross monthly rent-to-price ratio. Pittsburgh, at $270,000 with $1,875 in rent, runs a 0.69% ratio, a meaningfully stronger yield despite the heavier tax bill. Pittsburgh's tax disadvantage and rent advantage roughly cancel out; Philadelphia's tax advantage and higher price roughly cancel out. Two different paths land at nearly the same destination.
This matters beyond Pennsylvania. A lower advertised tax rate is not, by itself, a reason to prefer one city over another. The number that actually predicts cash flow is the full PITI-to-rent relationship, and a city can have the lowest tax rate in a comparison and still be the worse investment once price and rent are factored in. Run the full math before a tax-rate headline changes your city shortlist.
Suburban Allegheny County: the one Pennsylvania market that still works
| Item | Monthly |
|---|---|
| Loan amount ($131,250 at 6.65%) | P&I: $843 |
| Property tax (1.39% suburban Allegheny) | $203 |
| Insurance | $100 |
| Total PITI | $1,146 |
| Gross monthly rent (3BR SFR) | $1,550 |
| Effective rent (8% mgmt, 5% vacancy) | $1,355 |
| Capex reserve | ($100) |
| Net cash flow | +$109/month |
| DSCR (effective rent / PITI) | 1.35 |
At $175,000 in a municipality like Penn Hills, Baldwin, or Plum Borough, the combination of the 1.39% suburban tax rate and rents holding near $1,550/month for a 3-bedroom SFR still produces a positive result even after the rate moved from 6.47% to 6.65% and the county's millage hike is fully priced in. Cash flow has thinned from the +$134/month this site found in June to +$109/month now, and DSCR has slipped from 1.38 to 1.35, both still comfortably above the lender minimums that matter for financing. This is the only one of the three Pennsylvania markets modeled here where the direction of the second-pass numbers is a modest decline rather than a full reversal.
That distinction is the whole story for anyone sizing up Pennsylvania: the entry price matters more than the city label. Pittsburgh at $175k in the suburbs works. Pittsburgh at $270k in the city doesn't. The same $95,000 price gap explains most of the difference, not the tax rate.
Pennsylvania's income tax edge is real, but it's a tax-time benefit, not a cash flow fix
Pennsylvania's 3.07% flat state income tax remains the lowest in the Northeast, unchanged since the original June underwrite. On $15,000 of net annual rental income, a Pennsylvania investor owes $462 in state tax, versus $962 for a comparable New York investor and $750 for a Massachusetts investor, a saving of several hundred dollars a year that compounds over a multi-year hold. That advantage is real and it's clean in Pittsburgh and everywhere outside Philadelphia city limits. Inside Philadelphia, the added 3.44% Net Profits Tax on non-resident rental income largely erases it.
None of that changes the monthly math above. A tax-time saving of a few hundred dollars a year works out to $20-$40 a month, nowhere near enough to close a $418-$432 monthly cash flow gap. The income tax advantage is worth factoring into a hold-period return calculation for a property that already cash-flows. It's not a reason to buy a property that doesn't.
The math points toward a clear allocation call: suburban Allegheny County sub-$200k remains the only genuine cash-flow thesis in Pennsylvania, exactly as it was in June, and both Pittsburgh and Philadelphia at their current city medians are appreciation-and-tax-advantage plays, not income plays, until prices correct or rents catch up. If you're already comparing suburban Pittsburgh against other Rust Belt entry markets, see how it stacks up against Cleveland on a straight income comparison. For financing either market, a DSCR of 1.35 in the suburbs clears most lenders' preferred DSCR loan tier, while the negative-DSCR city numbers won't qualify without a larger down payment. Check the SFR yield county map for how Allegheny County's yield compares to other investor markets nationally before committing capital.