 Property
In June, this site told you a Portland single-family rental loses $1,445 a month. That number was wrong, and not because the market moved. It was wrong because it used a citywide blended rent average instead of what an actual 3-bedroom house rents for. The corrected number is $660 a month. That's still a loss, and Oregon still fails to clear a 1.0 DSCR anywhere in the state, but if you crossed Portland off your list in June based on the old figure, you crossed it off for a reason that overstated the damage by more than double.
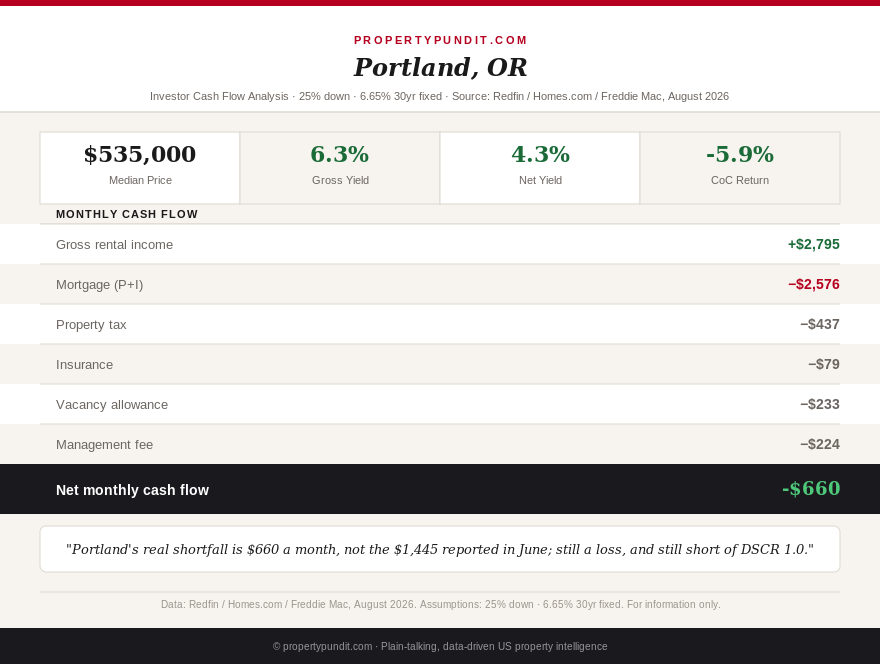
This is a second pass on Oregon, and it exists specifically to correct that error, not to pretend the first article never happened. The original June 24 Oregon spotlight is still live, and the numbers below replace it. Every figure here uses actual 3-bedroom single-family rent data pulled directly for Portland, Salem, and Eugene, current property prices, and the Freddie Mac PMMS rate as of August 20, 2026.
The correction changes the size of Oregon's problem. It doesn't change the verdict. Here's the full recalculation, why the original number was wrong, and where Oregon actually belongs on an investor's list now.
Get this in your inbox every Friday.
One email. The number that matters and what it means for you.
Why the June number was wrong
The June figure for Portland used a blended average rent across all unit types and sizes in the city, a mix that includes studios and one-bedroom apartments alongside single-family houses. That blend pulls the average rent down, because small units rent for much less than a 3-bedroom house and vastly outnumber them in most rental datasets. When you're underwriting an actual single-family rental, the blended citywide number is the wrong comparison, and it understated Portland's rent by roughly 35% in this case.
A targeted search specifically for 3-bedroom houses currently for rent in Portland returns a median of $2,795 a month (Homes.com, August 2026), against an effective rent of $1,661 implied by the blended figure used in June. That's the entire size of the correction. The property, the price, and the mortgage rate all moved by ordinary amounts between June and August. The rent line moved because the earlier search was measuring the wrong thing.
So what for you: if you're underwriting any single-family rental anywhere, run the rent search specifically for the bedroom count and property type you're buying, not a citywide or metro-wide average, because the gap between the two can change your cash-flow conclusion entirely.
The corrected Oregon cash flow table
All three markets below use the Freddie Mac PMMS rate of 6.65% (August 20, 2026), 25% down, 5% vacancy, and 8% property management, matched against 3-bedroom single-family rent data pulled directly for each city.
| City | Median price | Down (25%) | P&I/mo | PITI/mo | Eff. rent/mo | Cash flow | DSCR |
|---|---|---|---|---|---|---|---|
| Portland | $535,000 | $133,750 | $2,576 | $3,092 | $2,432 | -$660 | 0.79 |
| Salem | $450,000 | $112,500 | $2,167 | $2,598 | $1,790 | -$807 | 0.69 |
| Eugene | $479,900 | $119,975 | $2,311 | $2,766 | $1,923 | -$843 | 0.70 |
Portland's shortfall dropped from $1,445 to $660, a swing of $785 a month, purely from the rent correction (Portland median price also rose from $529,000 to $535,000 over the same window, a minor offsetting factor). Salem and Eugene, where the June figures were closer to accurate to begin with, moved by smaller amounts: Salem's loss widened slightly to $807 as its 3-bedroom rent came in lower relative to price growth, and Eugene's loss narrowed to $843. None of the three comes close to a 1.0 DSCR, let alone the 1.25 that most DSCR lenders require. For investors using DSCR financing rather than full income-documentation conventional loans, all three Oregon markets remain functionally ineligible, not just unprofitable, a distinction covered in more detail in the DSCR loan investor guide.
So what for you: Portland is a meaningfully smaller loss than this site previously told you, but "meaningfully smaller loss" isn't the same statement as "profitable," and the financing math still locks out DSCR-loan buyers at every price point in the state.
The tax and rent-cap structure hasn't changed
While the rent figure needed correcting, Oregon's regulatory environment didn't move between June and August, and re-checking it directly rather than trusting the old cache entry confirmed both pieces are unchanged. Oregon's top income tax rate remains 9.9%, applying to rental net income at ordinary rates with no capital gains preference on exit. Statewide rent control under SB 608 remains capped at 9.5% for 2026, confirmed directly against the Oregon Department of Administrative Services' 2026 Rent Stabilization Percentages release, the same cap in effect when the original article published.
Landlord insurance for a Portland or Salem single-family rental currently runs $800 to $1,100 a year depending on wildfire hazard zone and structure age (Steadily, 2026), which is what the table above uses. That's genuinely inexpensive by national standards, one of the lowest state averages in the country, and it's the one line item where Oregon doesn't work against you. It just isn't enough to offset the income tax and rent cap combination.
So what for you: Oregon's tax bill and rent ceiling are stable, known costs you can underwrite with confidence, which is more than you can say for states where these figures shift between legislative sessions, but stable doesn't mean small.
Where Oregon ranks now
The corrected numbers move Oregon up from "the worst state on the list" to "a bad state on the list with one market that's closer to viable than it looked." Portland at a 0.79 DSCR is still a loss, but it's a loss an investor with strong outside income and a long appreciation horizon could plausibly carry, particularly if Portland's price growth resumes after the current stretch of 73 days on market and rising inventory works through (Redfin/Altos, 2026). Salem and Eugene remain the weaker of the three, and neither correction moved them meaningfully.
For comparison, Washington state, Oregon's northern neighbor, carries no state income tax at all, which changes the after-tax math on rental income substantially even where property prices run similar. And Nevada, also income-tax-free, adds a 3% property tax abatement most landlords never bother to claim. Both are worth underwriting before Oregon if state tax exposure is your primary concern. For a broader view of where cash flow actually clears the bar at the county level, the single-family rental yield county map covers markets where the math works without needing a correction to get there.
So what for you: if Oregon stayed on your shortlist only because of the size of the old Portland number, it's fair to put it back under consideration, but if you ruled it out on the tax structure and rent cap rather than the cash-flow figure, nothing here should change your decision.
The verdict
The math points toward treating Oregon the same way this site suggested in June, just with a smaller monthly gap to bridge. Portland at a corrected $660 monthly shortfall and 0.79 DSCR isn't investable on a standard DSCR loan, but it's close enough that an investor buying with a larger down payment, say 35-40% instead of 25%, could plausibly reach breakeven, a calculation worth running before dismissing the market outright. Salem and Eugene remain clearer passes at current prices.
Frankly, if you're an investor who wrote off Oregon entirely based on the June figure, the honest move is to re-run Portland specifically at a higher down payment before deciding. If you're new to Oregon and cash flow is your primary goal, Washington and Nevada still make more sense on a pure numbers basis, and most investors comparing all three end up parking their capital in the state without the income tax and rent ceiling working against them from day one.