 Property
You saw the headline this week, "home sales fall," and for a second you let yourself hope it meant the market was finally cracking, that maybe the house you keep refreshing on Zillow might drop into reach. Then you read the second line: the median price hit a record. Sales down, prices up, in the same report, on the same day. If that felt like the data contradicting itself, it wasn't. It's actually one of the most common misreadings in housing coverage, and understanding why will save you from waiting on a price drop that the numbers don't actually support.
The myth: fewer sales means lower prices
It's an intuitive assumption. Fewer people buying should mean sellers have to cut their price to find a buyer, the same way a slow month at a car dealership usually comes with bigger discounts. Housing doesn't work that way, because the "price" being reported isn't a discount off a sticker, it's the median of whatever homes actually closed that month. When the mix of buyers changes, the median can move in a direction that has nothing to do with whether homes are getting cheaper or more expensive to buy. So what for you: a sales-volume headline alone tells you almost nothing about whether your specific target price range is softening.
What actually happened in June
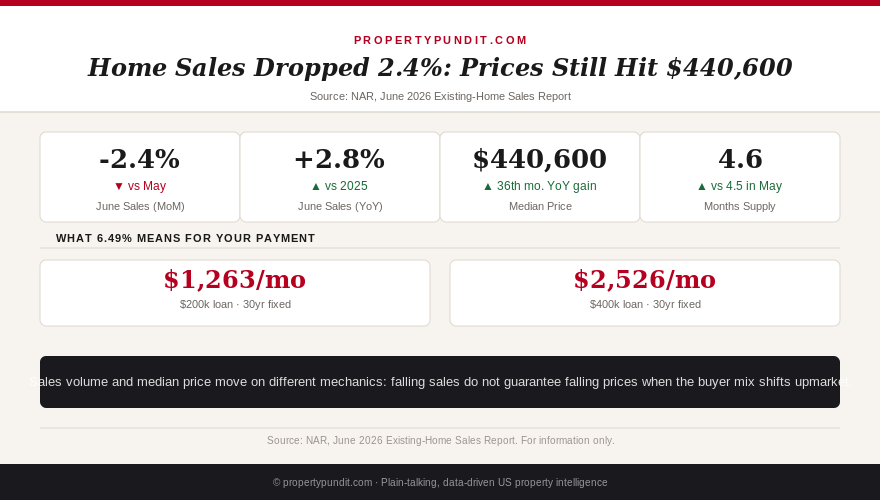
The National Association of Realtors reported that existing-home sales fell 2.4% from May to a seasonally adjusted annual rate of 4.09 million, the kind of month-over-month wobble that's common when affordability is tight. But sales were still up 2.8% compared with June of last year. The median existing-home price hit $440,600, a record for the series and the 36th consecutive month of year-over-year price gains. Months of supply ticked up to 4.6 from 4.5 in May. Every one of those numbers is real, and none of them individually tells the full story. So what for you: if you only read the top-line "sales fall" headline, you walked away with half the picture and the wrong conclusion.
Get this in your inbox every Friday.
One email. The number that matters and what it means for you.
Why sales and prices can move in opposite directions
Here's the mechanism. When rates and prices are both high, the buyers who get priced out first are the ones with the least cushion, often first-timers stretching to hit a 5% down payment. The buyers who remain in the market tend to be move-up buyers selling an existing home for equity, or buyers with stronger incomes and larger down payments who aren't as sensitive to a 6.49% rate. Fewer total transactions, but the ones that do happen skew toward pricier homes. That shifts the median up even while the number of deals shrinks. Add the well-documented lock-in effect, millions of homeowners sitting on 3-4% mortgages who won't sell and add to entry-level supply, and you get a market where the cheap end stays scarce no matter how many total sales slow down. So what for you: the segment you're actually shopping in, entry-level and first-time buyer inventory, can behave very differently from the national median being reported.
It isn't uniform everywhere
National figures also hide real regional splits, which matters if you're shopping in a specific metro rather than the country as a whole. Inventory growth has slowed to a crawl nationally, up just 1.9% year-over-year as of the end of June, a sharp deceleration from the 28.9% growth rate the same week a year earlier. But that national number blends regions moving in different directions: the Northeast and Midwest remain supply-constrained and are posting the strongest inventory growth off a low base, while the South and West, after two years of working through a supply correction, are now seeing inventory shrink again in some states. So what for you: a national "sales fell, prices didn't" headline can mask a local market that's actually softening, or one that's tighter than the country as a whole, and the only way to know which applies to you is to check your specific metro's numbers rather than extrapolate from the national release.
A simplified example of the mechanism
Picture a market with 100 sales last month split evenly between $300,000 starter homes and $600,000 move-up homes, for a median around $450,000. Now suppose affordability tightens and 15 of the starter-home buyers drop out entirely, priced out by the combination of rate and price, while every move-up buyer stays in because they're selling an existing home for equity rather than financing from scratch. Total sales fall from 100 to 85, a real decline. But the mix has shifted toward the pricier half of the market, so the median can tick up even though fewer people bought anything at all. This is a simplified illustration of the mechanism, not a claim about the actual composition of June's sales, but it's the same math driving the real NAR numbers. So what for you: the buyers most likely to have been squeezed out of this month's sales count look a lot like you, which is exactly why the median price climbing doesn't mean your target price range got more competitive.
The number that actually predicts a price drop
If sales volume isn't the signal, what is? Months of supply is the closer proxy, because it measures how long it would take to sell every home currently listed at the current sales pace. Most housing economists treat somewhere around 6 months of supply as the rough line between a seller's market and conditions where broad price declines start to show up. National supply sits at 4.6 months, up from 4.5 the month before, which is real movement toward balance, but it's still on the tight side of that 6-month line. So what for you: watch months of supply and local price-cut share in the specific city and price range you're shopping, not the national sales headline, if you're trying to time a purchase around softening prices.
The call
Frankly, if you're holding off on house hunting because you're waiting for a national price crash the sales headlines seem to be promising, the math doesn't back that bet. Thirty-six straight months of year-over-year price gains, including this latest report, is not what a crash looks like in progress. Most buyers who run these numbers end up focusing their energy on what they can actually control this week: shopping down payment assistance, checking exactly where their credit score lands them on the rate sheet, and understanding that you likely don't need anywhere near 20% down to get started. If cash for a down payment is the real holdup, there's often assistance money going unclaimed in most states, and it's worth knowing your full closing costs before you assume you're further away than you actually are.