 Property
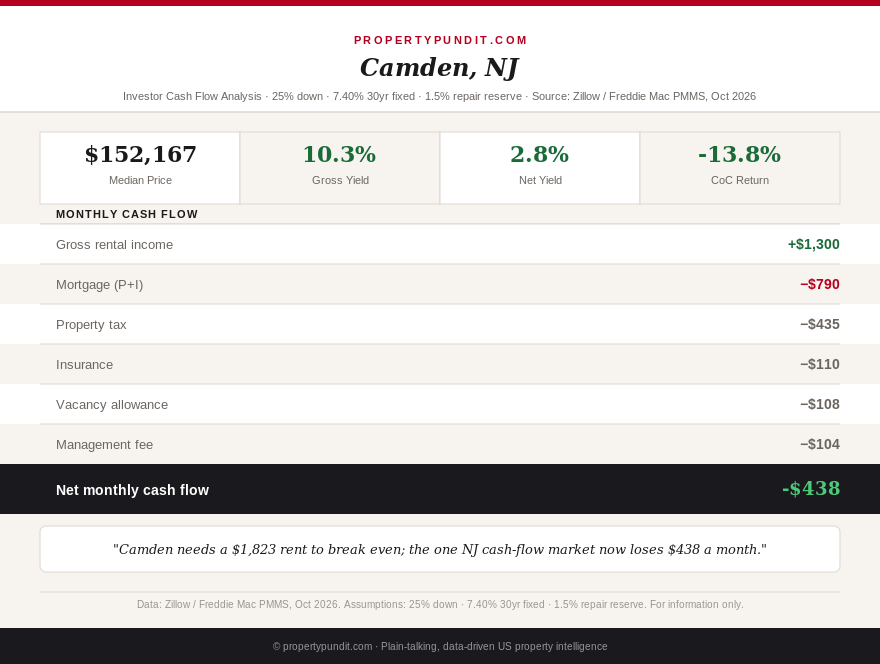
You've heard New Jersey is a property-tax trap, and then somebody showed you Camden: a house under $155,000, the highest tax rate in the state, and, in August, the only New Jersey market this site tested that still cleared cash flow. Before you wire a down payment, rerun it. At the Freddie Mac rate of 7.40% (October 15, 2026), with 25% down and a repair reserve, a median-priced Camden house loses $438 a month at a $1,300 rent and $30 a month at Zillow's $1,787 average rent. In August the same market showed +$79.
The rest of the state is worse. A median Gloucester County house loses about $1,388 a month, Ocean County about $1,822, and the statewide median about $2,242. Meanwhile the market is loosening: New Jersey Realtors reported September inventory up 12.1% from a year earlier and pending sales down 11.3% (New Jersey Realtors via ROI-NJ, October 16, 2026).
This is the third New Jersey pass of the year (June and August came first). The method matches the recent state passes: 25% down, a 30-year fixed at 7.40%, the county's effective property tax rate, an insurance estimate, 8% management, one month of vacancy a year and a 1.5% annual maintenance reserve.
Get this in your inbox every Friday.
One email. The number that matters and what it means for you.
New Jersey cash flow at 7.40%, market by market
| Market | Price | Rent | Full payment | Net cash flow | Coverage | Break-even rent | Break-even price |
|---|---|---|---|---|---|---|---|
| Camden city (house rent) | $152,167 | $1,300 | $1,335 | -$438 | 0.97 | $1,823 | $105,112 |
| Camden city (Zillow average rent) | $152,167 | $1,787 | $1,335 | -$30 | 1.34 | $1,823 | $148,919 |
| Gloucester County | $379,151 | $2,300 | $2,838 | -$1,388 | 0.81 | $3,959 | $213,793 |
| Ocean County | $488,906 | $2,400 | $3,219 | -$1,822 | 0.75 | $4,578 | $245,179 |
| Statewide median | $558,395 | $3,100 | $4,137 | -$2,242 | 0.75 | $5,779 | $288,353 |
Prices are Redfin September 2026 medians for Gloucester County ($379,151, up 5.8%), Ocean County ($488,906, down 0.33%) and the state ($558,395, up 2.3%), and Zillow's median sale price for Camden ($152,167, as of August 31, 2026). The Camden $1,787 rent is Zillow's average across all property types (September 30, 2026), while $1,300, $2,300 and $2,400 are house rent estimates carried from the August pass, and $3,100 is a RentCafe three-bedroom average from June. Effective property tax rates are 3.43% for Camden, 2.34% for Gloucester, 1.24% for Ocean and 2.23% for the state (Tax Foundation, 2026). Insurance runs $110, $130, $175 and $200 a month. "Full payment" means principal, interest, property tax and insurance; "coverage" is rent divided by that payment.
Look at the Camden row with $1,787 rent. Coverage is 1.34, which would pass many DSCR lenders' bar of 1.0 or better (see the DSCR loan guide), yet the house still loses $30 a month once management, vacancy and repairs come out. A loan approval and a profitable rental are different tests.
So what for you: if you want a New Jersey rental that pays for itself at 7.40%, none of these markets does it with the rents I could verify, and Camden only gets within $30 of break-even if you believe the higher rent.
Why Camden's +$79 became -$438
The August pass published +$79 using a $122,990 price, a $1,300 rent and a 6.69% rate, and it netted 12.6% off the rent ($1,136) for vacancy and costs instead of itemizing them. Rebuilding that result step by step shows where the money went:
| Step | Net per month | Change |
|---|---|---|
| August pass as published (6.69%, $122,990, $1,300 rent) | +$79 | |
| Today's method, same inputs (8% management, a full vacancy month, 1.5% repair reserve) | -$122 | -$201 |
| Rate rises to 7.40% | -$166 | -$44 |
| Price source changes to $152,167 | -$438 | -$272 |
| Rent swapped for Zillow's $1,787 average | -$30 | +$408 |
The rate hurts less than you'd expect, only $44 a month, because Camden's loan is small ($114,125). The biggest single driver is the price input, and it comes with a warning. August used $122,990, a Zillow value that was up 7.9% that year. Zillow's Camden page now shows a typical home value of $149,376, down 3.2% from a year earlier (Zillow, September 2026), and a median sale price of $152,167 (August 31, 2026). I can't tell whether Camden jumped more than 20% in two months, which would be odd given the year-over-year decline, or whether the two figures measure different things. If $122,990 was the outlier, Camden never cleared cash flow under today's method and August's +$79 was flattered by the lighter cost allowance.
So what for you: any Camden number you've seen from this site or others before this fall probably used a lighter cost allowance, so rerun it with a full vacancy month and a repair line before you rely on it.
The Camden rent question: $1,300 or $1,787
Break-even rent for the $152,167 house is $1,823 a month. That's 40% above the $1,300 house estimate and 2% above Zillow's $1,787 average (Zillow, September 30, 2026). The $1,787 figure averages every rental type in the city, apartments included, so it is probably generous for a single-family house; the August pass found a citywide average of $1,209 and a median of $1,500 from Zillow Rental Manager and Rent.com. I couldn't find a house-specific Camden rent comp for this pass.
Camden also has local rent control, a 1981 ordinance that caps annual increases around 6% but allows a reset to market rent when a tenant leaves voluntarily or is evicted for nonpayment (the August pass). New Jersey has no statewide rent control, though roughly 117 to 128 municipalities have local ordinances, covering about two-thirds of the state's rental stock, depending on the source. If you buy in Camden, verify what the ordinance allows before you underwrite year-two rent.
So what for you: Camden works only if your specific house rents for at least $1,823, so get a written lease comp for the address before you make an offer.
Does price growth cover the carry?
An investor can lose money every month and still come out ahead if the price rises enough. Take the yearly cash loss, subtract the first-year principal you pay down, and divide by the purchase price. That's the annual growth needed just to break even, before selling costs and taxes.
| Market | Yearly cash loss | Year-one principal | Growth needed | Recent price change |
|---|---|---|---|---|
| Camden ($1,300 rent) | $5,252 | $1,073 | 2.7% | -3.2% (Zillow typical value, September 2026) |
| Camden ($1,787 rent) | $363 | $1,073 | -0.5% (principal covers it) | -3.2% (Zillow typical value, September 2026) |
| Gloucester County | $16,654 | $2,673 | 3.7% | +5.8% (Redfin, September 2026) |
| Ocean County | $21,866 | $3,447 | 3.8% | -0.33% (Redfin, September 2026) |
| Statewide median | $26,900 | $3,937 | 4.1% | +2.3% (Redfin, September 2026) |
Gloucester County is the only market where recent growth (5.8%) beats the growth needed (3.7%). That would be a real appreciation case, except Redfin shows closed sales there down 10.3% from a year earlier and a median of 34 days on market, 4 days slower than last year, at 101.0% of list price (Redfin, September 2026). Prices are rising while buyers pull back, which is how momentum stalls. Camden's price is falling, so the lower-rent case needs growth it isn't getting.
So what for you: Gloucester is the one place where an appreciation bet has recent data behind it, but you'd be paying about $16,700 a year to hold it, so only consider it if you can carry the loss for several years.
The market is loosening, which changes the bargaining
New Jersey Realtors' September report shows 22,746 homes for sale, up 12.1% year over year, new listings up 3.8%, closed sales down 5.8% and pending sales down 11.3%. The statewide median sale price was $550,000, up 2.8%, with the single-family median at $615,000, up 3.4%, and homes spent a median of 39 days on the market, up 5.4% (New Jersey Realtors via ROI-NJ, October 16, 2026). Redfin's September data shows 32,962 homes for sale, up 9.0%, with 4 months of supply, 46.2% of homes selling above list price and 13.3% with price drops (Redfin, September 2026).
The two sources disagree on days on market. New Jersey Realtors says 39 days, up 5.4%; Redfin says 44 days, 5 days faster than a year ago. They use different data sets and calculation methods, and I couldn't confirm which is closer for investor-grade houses. They agree on direction for inventory and demand. The August pass had counted 2.2 to 3.2 months of supply by county and 48.3% of homes selling above list in June (Redfin, June 2026). Redfin's statewide 4.0 months and 46.2% above list aren't a clean comparison because the geography differs, but the August "deep seller's market" label no longer fits as cleanly.
So what for you: with inventory up and pending sales down, ask for a price cut or a seller credit toward a rate buydown on any New Jersey purchase; you're negotiating from a better spot than you were in August.
Taxes: the 3.43% problem
Camden's 3.43% effective rate means $435 a month in property tax on a $152,167 house, which is 33% of the $1,335 full payment. New Jersey's statewide average is 2.23%, the highest in the country, with a median annual bill of $8,809 (Tax Foundation, 2026). The July 2025 mansion tax change, which moved the tax on sales over $1 million from the buyer to the seller (Assembly Bill A5804), doesn't affect any of the houses tested here, but matters if you plan an eventual exit on a larger multifamily property.
Compare Ocean County's 1.24% rate with Gloucester's 2.34%: on the same $379,151 house, Ocean's rate would save about $347 a month in taxes.
So what for you: before you buy anywhere in New Jersey, get the town's actual tax rate and last revaluation date, because the difference between 2.34% and 3.43% on a $152,000 house is $138 a month.
What this means for you
Stop treating Camden as New Jersey's cash-flow exception. The math points toward passing unless you can document a $1,823 rent for the specific house, and even then the margin is thin and the price trend is down. If your thesis is appreciation, Gloucester has the data behind it but costs about $1,388 a month to hold. Ocean and the statewide median don't have a cash-flow or an appreciation case right now.
If you still want New Jersey, put more down or negotiate a seller credit, since every quarter point is worth roughly $49 a month on a $284,000 loan, and compare with markets where the rent-to-price ratio is higher. Even the best results elsewhere are near zero at this rate: a $175,000 Omaha house netted -$7 a month in the Nebraska pass, and Manchester, New Hampshire lost $1,767 a month in the New Hampshire pass.
What I couldn't verify
Several inputs are carried or estimated. The $1,300, $2,300, $2,400 and $3,100 rents come from the August and June passes, not new comps, and Zillow's $1,787 Camden figure averages all property types. Insurance runs $110 to $200 a month from earlier passes, not landlord (DP-3) quotes. The tax rates are Tax Foundation county or state effective averages, not parcel bills. The Camden price conflict ($122,990 in August versus $149,376 typical and $152,167 median now) is unresolved. I did not underwrite Jersey City, where Redfin shows a September median of $779,629, up 6.8%, because I have no verified house rent. I also did not find a Redfin or Zillow median for Essex or Hudson County for September. So what for you: treat the break-even rent and price as the firm part of this pass, and the monthly cash-flow figures as ranges until you have a lease comp and a landlord insurance quote for your own address.
Frequently asked questions
Is Camden, NJ still a good place for a rental property at 7.40% mortgage rates?
Not for cash flow. At 7.40%, a median-priced Camden house ($152,167) loses about $438 a month at a $1,300 rent and $30 a month at Zillow's $1,787 average rent, after 25% down, 8% management, one month of vacancy and a 1.5% repair reserve. In August it showed +$79.
What rent does a Camden house need to break even?
About $1,823 a month on a $152,167 purchase with 25% down at 7.40%. That is 40% above the $1,300 house estimate and 2% above Zillow's $1,787 all-property-type average (Zillow, September 30, 2026).
Why did Camden's cash flow drop from +$79 to -$438?
Three changes: a fuller cost method (-$201), a rate rise from 6.69% to 7.40% (-$44) and a price input that moved from $122,990 to $152,167 (-$272). Using Zillow's higher $1,787 rent instead of $1,300 would add back $408.
Is New Jersey a buyer's market now?
Not yet, but it is loosening. New Jersey Realtors reported September inventory up 12.1% and pending sales down 11.3% (October 16, 2026), and Redfin shows 4 months of supply with 13.3% of listings cutting price (September 2026). Four months is balanced territory, so ask for credits but do not expect deep discounts.