 Property
You have about $43,750 to put down and a lender that wants 25% on an investment loan, so the only Massachusetts house that works at 7.28% is a $175,000 one in Springfield, and it clears just $47 a month. The state's median-priced rentals tell the opposite story: a typical Boston house loses $3,033 a month, Worcester $1,297 and Springfield $923, after management, vacancy and a maintenance reserve.
This is our third pass on Massachusetts, after the June 9 first pass and the July 31 second pass. The benchmark moved from 6.66% to 7.28% (Freddie Mac PMMS, July 30 and October 1, 2026). I underwrote each market with 25% down, an 8% management fee, one month of vacancy a year and a 1.5% annual maintenance reserve, the same method as our other third-pass states. July used 8% management and a 5% vacancy rate with no maintenance reserve, so I recomputed July's inputs at today's method before comparing them below.
Rents were the biggest correction. Three of July's four rent estimates came in below what Rentometer now reports for house rentals, which is why most results improved even as the rate rose 62 basis points. The inputs I could not refresh are flagged in each section.
Get this in your inbox every Friday.
One email. The number that matters and what it means for you.
Boston closes in 26 days at 99.4% of list
Redfin puts Boston's median sale price at $859,431 for August 2026, up 3.4% from a year earlier, with homes taking a median 26 days to sell and closing at 99.4% of list price on 1,613 sales, up 2.4% (Redfin, August 2026). That's a market where sellers still hold the cards, which is bad news for a buyer who needs rent to cover a mortgage.
Outside Boston, Redfin's January through March average put Worcester's median sale price at $450,000, up 0.6%, and Springfield's at $349,167, up 4.3% (Redfin via Stacker, April 30, 2026). Those are the newest sourced figures I could find for those two cities. July's pass used $480,000 for Worcester and a blended $318,000 for Springfield, so part of the change below is a source change and not a market move. Springfield's 4.3% was the fastest gain of the three, though the figures cover different months. What it means for you: check the price on any house you underwrite before you trust a city-level median.
Four Massachusetts rentals, one table
| Monthly line item | Boston | Worcester | Springfield | Springfield entry-level |
|---|---|---|---|---|
| Price | $859,431 | $450,000 | $349,167 | $175,000 |
| Down payment (25%) | $214,858 | $112,500 | $87,292 | $43,750 |
| Rent (house) | $4,300 | $2,800 | $2,397 | $1,900 |
| Principal and interest (7.28%) | $4,410 | $2,309 | $1,792 | $898 |
| Property tax | $888 (1.24%) | $626 (1.67%) | $550 (1.89%) | $276 (1.89%) |
| Insurance | $258 | $142 | $150 | $150 |
| Management (8%) | $344 | $224 | $192 | $152 |
| Vacancy (one month a year) | $358 | $233 | $200 | $158 |
| Maintenance reserve (1.5% a year) | $1,074 | $562 | $436 | $219 |
| Net monthly cash flow | -$3,033 | -$1,297 | -$923 | +$47 |
| Coverage ratio (rent / PITIA) | 0.77 | 0.91 | 0.96 | 1.44 |
| Rent needed to break even | $7,925 | $4,351 | $3,500 | $1,844 |
The coverage ratio hides the damage. Springfield's median house clears 0.96 and Worcester's 0.91, both near the 1.0 floor DSCR lenders use, yet each still loses money every month once operating costs come out. Only the entry-level Springfield house is both approvable at 1.44 and cash-flow positive. What it means for you: ask your lender for the DSCR and then calculate the cash flow yourself, because the two answers diverge here.
Boston: a $3,033 monthly loss on a $214,858 down payment
Rentometer's March 9, 2026 data puts a three-bedroom Boston house at a $4,857 average and a $4,300 median (Rentometer, March 2026). I used the median. At 7.28% the principal and interest alone is $4,410, the tax at the city's non-owner-occupied rate of 1.24% adds $888, and insurance at $258 uses MoneyGeek's statewide figure for $500,000 of dwelling coverage, $3,098 a year (MoneyGeek, 2026). A real landlord policy on an $859,000 house will likely cost more.
Break-even rent is $7,925, 84% above the $4,300 a tenant pays today, and the annual loss is $36,395. To break even at the current rent, the price would have to fall to roughly $450,000, about 48% below the median. Boston is an appreciation bet that costs about $3,033 a month to hold. What it means for you: if you buy Boston, the plan is the sale price in year ten and not the rent check.
Worcester: rent came in $400 above July's estimate
July assumed $2,400 for a Worcester house. Rentometer's January 10, 2026 data shows a three-bedroom house at a $2,756 average and a $2,800 median (Rentometer, January 2026), so the rent was too low by about $400, though the page is nine months old. Insurance is $142 a month, MoneyGeek's Worcester average of $1,708 a year (MoneyGeek, 2026), and the tax rate is about 1.67% as carried from July.
At $450,000 and $2,800 rent, Worcester loses $1,297 a month against $1,753 on July's inputs, a $456 improvement from rent and the lower price. Break-even rent is $4,351, 55% above today's, and the annual loss is $15,568. What it means for you: a nine-month-old rent comp could be off in either direction, so verify it on the street you're buying before you decide the city "almost works."
Springfield at $349,167: nearly a coverage pass, still a loss
Rentometer's April 24, 2026 data shows a three-bedroom Springfield house at a $2,453 average and a $2,397 median, with two-bedroom houses at $1,885 and $1,900 (Rentometer, April 2026). The page's own narrative quotes higher figures than its table, so I used the lower table median. Springfield also carries the highest tax rate in the table, about 1.89%, or $550 a month.
The loss is $923 a month, break-even rent is $3,500 (46% above today's) and the annual loss is $11,072. That is better than July's recomputed $945 only because rent rose; the price I used is higher. What it means for you: the median Springfield house is a near-miss, and a $349,000 price is the wrong place to look for cash flow.
The $175,000 Springfield house: positive by $47
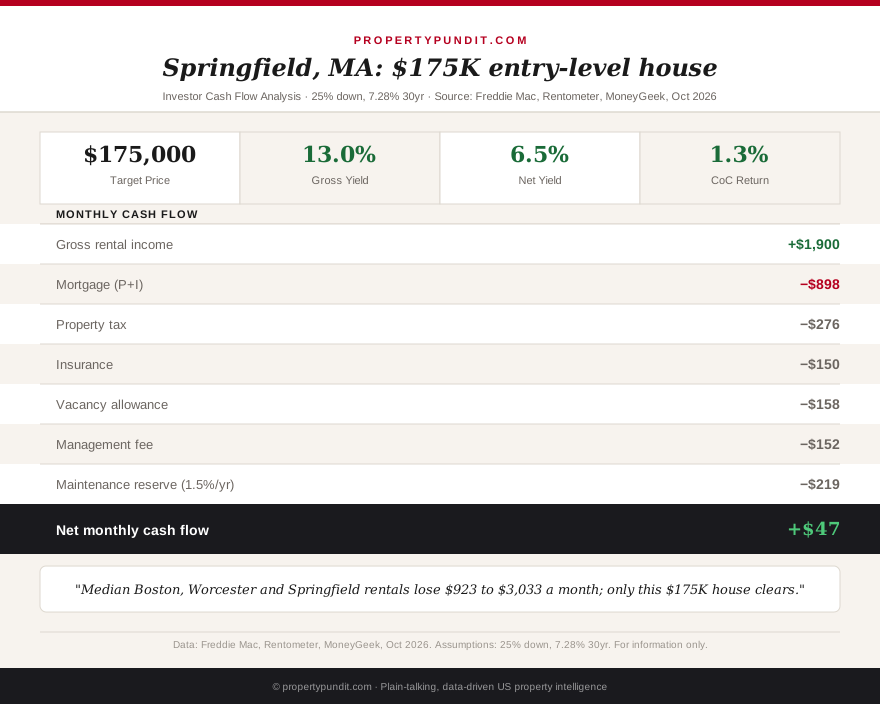
This is the one case that clears. A two-bedroom house rents for $1,900 (Rentometer, April 2026), and at a $175,000 price with 25% down, principal and interest is $898, tax $276 and insurance $150. Net cash flow is +$47 a month, or +$567 a year on $43,750 down, a 1.3% cash-on-cash return. Gross yield is 13.0% and net operating yield 6.5%.
Treat that result as fragile. The $175,000 price is a target I carried from July, not a verified median, and I haven't confirmed that sound two-bedroom houses are available at that price. Break-even rent is $1,844, only 3% below the $1,900 assumed. At $1,800 rent the result becomes -$36 a month, and at a $250 insurance quote it falls to -$53. The rent is also a two-bedroom figure and not the three-bedroom number used elsewhere.
Massachusetts landlord law is the other risk. Evictions average four to six months, security deposits are capped at one month's rent, and a landlord pays the full residential tax rate with no investor exemption, as covered in our July Massachusetts pass. A statewide rent control ballot question was struck by the Supreme Judicial Court on June 23, 2026 over a drafting flaw, but advocates are pursuing the same policy through the legislature, so regulatory risk isn't resolved. What it means for you: a $47 monthly cushion disappears with one bad tenant month, so only buy here with reserves for a long vacancy.
What moved since July
| Market | July inputs, recomputed | Today | Change |
|---|---|---|---|
| Boston | -$3,015 | -$3,033 | -$18 |
| Worcester | -$1,753 | -$1,297 | +$456 |
| Springfield | -$945 | -$923 | +$22 |
| Springfield entry-level | -$57 | +$47 | +$105 |
Three of four improved, almost entirely because July's rent estimates were low. That's unusual for our third passes, where most numbers got worse, and it's a reminder that a first-pass guess can err in the investor's favor too. What it means for you: re-check the rent comp before you re-check the rate.
What this means for you
At 7.28% and 25% down, no median-priced Massachusetts market produces positive cash flow, and Boston loses $36,395 a year. Only a $175,000 Springfield house nets a few dollars, and that depends on an unverified price. If monthly cash flow is the goal, our single-family yield county map shows where yields still clear, and the DSCR loan guide explains why a passing ratio doesn't guarantee a profit. Maryland's October 7 pass shows a similar pattern in our Baltimore analysis.
Frankly, if you want Massachusetts exposure, buy it as a long-term appreciation hold with cash set aside for $15,568 to $36,395 a year of carrying cost, or look for a real sub-$175,000 Springfield listing and underwrite that exact address with a landlord insurance quote.
Frequently asked questions
Is Massachusetts rental property profitable in 2026?
Not at median prices. At 7.28% and 25% down, a median Boston house loses about $3,033 a month, Worcester $1,297 and Springfield $923. Only a $175,000 Springfield house nets a small $47.
Which Massachusetts city has the best rental cash flow?
Springfield, but only at entry-level prices. A $175,000 house renting for $1,900 nets $47 a month, a 1.3% cash-on-cash return. The median Springfield house at $349,167 loses $923 a month.
What rent does a Boston house need to break even at 7.28%?
About $7,925 a month on an $859,431 purchase with 25% down, after 8% management, one month of vacancy and a 1.5% maintenance reserve. That's 84% above the $4,300 median house rent.
Why did the Massachusetts results improve since July?
Rent estimates were too low in July. Rentometer now shows house rents $250 to $400 higher in Springfield and Worcester, which outweighed the higher mortgage rate and insurance costs.