Homes Rose 1.9% in July: a 1.5% Real Loss, or Just 0.6%?
By The Property Pundit·Published: ·Data last verified: September 30, 2026·7 min read
Key points
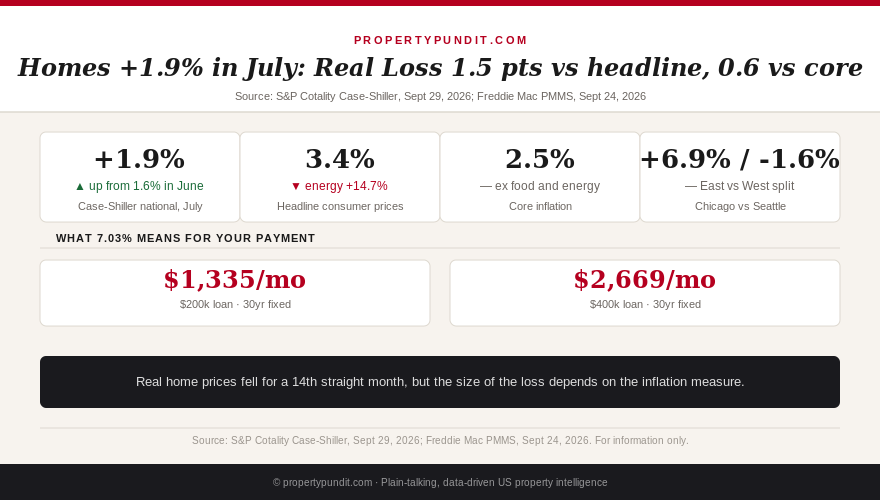
S&P Cotality Case-Shiller's national index rose 1.9% in July 2026, up from 1.6% in June, as the 20-city composite gained 2.5%.
Consumer prices rose 3.4%, so real home values fell for a 14th straight month: a 1.5-point gap.
Energy prices rose 14.7% and gasoline 24.6%. Against core inflation of 2.5%, the real loss shrinks to 0.6 points.
You bought at 3.8%, your house is worth about 1.9% more than a year ago, and this morning's headline says you're losing ground to inflation for a 14th straight month. Before you decide what that means for your equity, know that the size of the loss depends on which inflation number you pick, and July's reading was pushed around by gasoline.
S&P Cotality Case-Shiller reported on September 29 that its national index rose 1.9% year over year in July 2026, up from 1.6% in June. The 20-city composite rose 2.5% and the 10-city composite rose 3.4%. Consumer prices rose 3.4% over the same 12 months, so real, inflation-adjusted home values fell again (HousingWire and RISMedia, September 29, 2026).
Why the "real loss" changes with the inflation number
The 3.4% inflation reading came mostly from energy. S&P's Rebecca Kaufman noted that energy prices rose 14.7% and gasoline rose 24.6% in the year to July, while core inflation, which strips out food and energy, ran 2.5% (S&P Cotality, September 29, 2026). Homes don't burn much gasoline, so the two measures tell different stories about what your house "should" have done.
Inflation measure (July 2026)
Rate
Home price gain (+1.9%) vs inflation
Headline consumer prices
3.4%
-1.5 points
Core (excluding food and energy)
2.5%
-0.6 points
Energy only
14.7%
-12.8 points
Neither number is "right." Headline inflation is what you paid at the pump and the store, so it's the right measure for your household budget. Core inflation is a better guide to persistent price pressure, the kind that eventually shows up in rents, wages, and, in principle, housing. If gasoline falls back, the headline gap can close without a single home changing price.
The gap is already narrowing. Our September 2 data drop covered June, when a 1.5% price gain ran against 3.5% inflation, a 2.0-point shortfall. July's shortfall is 1.5 points, because prices firmed while inflation cooled slightly (S&P Cotality, September 2026). Read that as a slow improvement, not a recovery, and see the June breakdown for the earlier baseline. For your decision, treat a headline real-price drop as a range rather than a verdict.
Get this in your inbox every Friday.
One email. The number that matters and what it means for you.
A $400,000 home, three ways to measure it
Suppose you bought a $400,000 house a year ago. At the national 1.9% gain, it's worth about $407,600 today. To have kept pace with headline inflation of 3.4%, it would need to be worth $413,600, so you're about $6,000 behind in purchasing power. Against core inflation of 2.5%, the benchmark is $410,000, and you're about $2,400 behind.
That $3,600 difference between the two benchmarks is the energy effect. It doesn't change what you could sell for. It changes whether the word "loss" is fair. And a $6,000 paper shortfall on a $400,000 asset is small next to what a 7.03% mortgage rate (Freddie Mac PMMS, September 24, 2026) does to a buyer's budget: $2,669 a month on a $400,000 loan versus the $1,864 you'd pay at 3.8%. If you're deciding whether to buy now, the mortgage rate matters far more to your budget than the real-price shortfall does.
The East is winning and the West is losing
Nationwide averages hide a split. Chicago led all tracked metros at 6.9%, New York gained 5.8%, and Cleveland gained 4.2%. On the other end, Seattle fell 1.6% for the second straight month as the largest decline, Las Vegas fell 1.3%, and Denver fell 1.1% (S&P Cotality Case-Shiller, July 2026). S&P noted that six of eight Eastern metros strengthened from June to July, versus just two Western ones. Detroit's July number is missing because Wayne County transaction records were delayed.
Subtract the 3.4% headline inflation rate and the regional gap gets sharper. Chicago owners beat inflation by 3.5 points. Seattle owners fell behind by about 5.0 points, and Las Vegas owners by 4.7. Same country, same inflation, opposite outcomes.
Metro (July 2026)
Price change
After 3.4% inflation
Chicago
+6.9%
+3.5 points
New York
+5.8%
+2.4 points
Cleveland
+4.2%
+0.8 points
Denver
-1.1%
-4.5 points
Las Vegas
-1.3%
-4.7 points
Seattle
-1.6%
-5.0 points
If you own in the West, treat your equity as flat to slightly down in real terms until your local trend turns. If you own in the East, you have room to hold and wait. Whichever side you're on, judge your equity by your own metro's number, not the national headline.
Why the national number trails the big cities
The three Case-Shiller readings tell a consistent story: 1.9% for the national index, 2.5% for the 20-city composite, and 3.4% for the 10-city composite. Bigger, more supply-constrained metros are pulling ahead of the country as a whole, and the Eastern cities are leading that group. Nationally, though, supply is loosening, with NAR reporting 4.9 months of inventory in August, the most in over a decade (NAR, August 2026). More inventory generally caps appreciation, which is why a 1.9% gain is a reasonable read for the typical owner even as Chicago runs at 6.9%. For you, that means comparing your own metro's number, not the national one, before you judge your equity.
What it means if you own at a low fixed rate
If you locked in 3.8% and the 3.4% inflation rate holds, your real borrowing cost is about 0.4%. That's close to free money in real terms, and it's the reason the lock-in effect keeps owners from selling. It also means the real-price headline overstates the pain for you: your asset lost about 1.5 points to inflation, but your debt lost about 3.4 points in real terms.
Put dollars on it: on a $300,000 balance, 3.4% inflation shrinks the real value of what you owe by roughly $10,200 in a year, while the first-year interest at 3.8% is about $11,400. Your net real cost of carrying that loan is about $1,200 a year, or $100 a month. A buyer paying 7.03% on the same balance faces first-year interest of about $21,100, a real cost near $10,900 after the same inflation credit. That's the gap that keeps you in your house, and it's a reason not to treat a 1.5-point real price shortfall as a crisis.
The catch is what's on the other side. The Federal Reserve raised its target range to 3.75%-4.00% on September 16, and traders put the odds of another hike on October 28 near 70% (CME FedWatch via Yahoo Finance, September 28, 2026). More hikes mean more pressure on the variable-rate debt in your household, such as a HELOC, without touching your fixed mortgage. Your move: keep the fixed mortgage, and treat any variable-rate borrowing as the thing to watch.
What this means for you
Don't sell, or refuse to sell, because of a real-price headline. If you own in Chicago, New York, or Cleveland, your equity outran inflation this year and you have room to be patient. If you own in Seattle, Las Vegas, or Denver, you're about 4.5 to 5 points behind inflation, and you should be skeptical of any plan that relies on a quick price rebound to fund a renovation or a move.
If you're buying, read the same data as a negotiation signal. Prices aren't falling in dollars, but they're shrinking in real terms in half the country, sellers are already giving concessions on 44.7% of sales (Redfin, August 2026), and every point of real decline is bargaining power. Ask for a seller credit or a rate buydown as well as a lower price, and compare each offer by its effect on your monthly payment rather than its headline size.
Watch two releases. The August PCE inflation report, due today, is expected to show prices up 0.4% for the month and 0.3% at the core level, and the September jobs report on October 2 is expected to show about 100,000 new jobs with unemployment rising to 4.2% (Yahoo Finance and TheStreet, September 28, 2026). A hot PCE print would push October hike odds higher and keep the real-price gap open into fall. A soft one would help both the mortgage market and the inflation side of this comparison.
Plain-talking US property market analysis. Data-driven. Slightly contrarian. No agenda except the numbers.
Read next
Data sourced from S&P Cotality Case-Shiller (July 2026 data, released September 29, 2026), reported by HousingWire and RISMedia, and the Bureau of Labor Statistics consumer price data as cited by S&P, plus Freddie Mac PMMS as of September 24, 2026. Worked examples are illustrations, not forecasts. This article is for information only and is not financial or investment advice.
Get the weekly Market Pulse
One email, Friday. The number that matters and what it means for you.
 Property