 Property
You check your home's value the way some people check a stock ticker: not obsessively, but often enough to know roughly where things stand. This week's number looks like good news at first glance. The S&P Cotality Case-Shiller National Home Price Index rose 1.5% year over year in June 2026, released August 25, 2026, its best annual gain since spring. But hold that thought before you feel any better about your equity: with inflation running at 3.5% the same month, your home's real, inflation-adjusted value fell again. That's not a one-off. It's the 13th consecutive month that's been true, and the number everyone is celebrating is smaller than the number quietly eating it.
If you own a home and track your rate the way you track everything else about your finances, this is the distinction that actually matters, more than the headline gain itself. Here's what the data says, why Chicago is the exception worth paying attention to, and what it means for your next move on rate and equity.
Get this in your inbox every Friday.
One email. The number that matters and what it means for you.
The nominal number everyone's celebrating
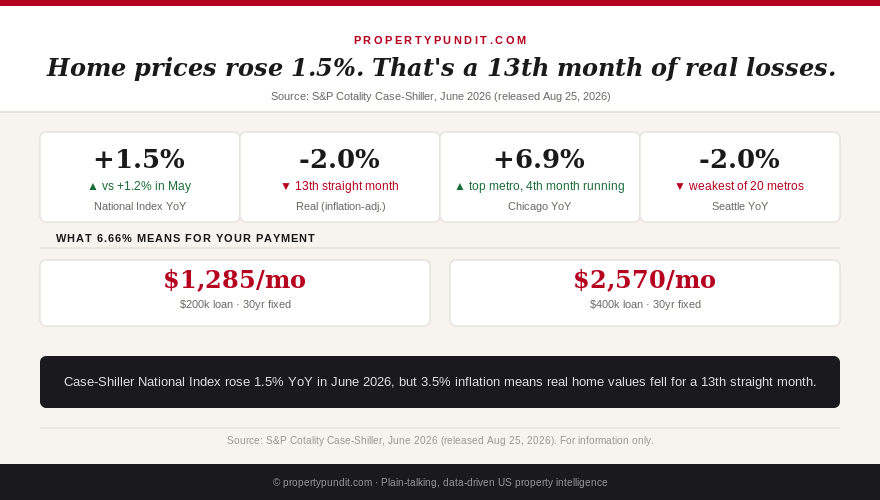
S&P Dow Jones Indices released the June 2026 Case-Shiller results on August 25, 2026. The National Index, which covers all nine U.S. census divisions, posted a 1.5% annual gain, up from 1.2% in May. The 10-City Composite rose 2.9% year over year, up from 2.4% the prior month, and the 20-City Composite rose 2.1%, up from 1.6%. On a seasonally adjusted monthly basis, the National Index and 20-City Composite gained 0.1% and 0.3% respectively in June, both consistent with June's position near the peak of the annual homebuying season.
Those are the fastest annual gains the index has posted since earlier this year, and taken alone, they read as a market stabilizing. Rebecca Kaufman of S&P Dow Jones Indices framed it exactly that way, noting that cooling inflation combined with firmer nominal price growth "helped slow the pace of erosion." That phrase, "pace of erosion," is the tell. Even the index's own analysis isn't calling this a recovery.
So what this means for you: a 1.5% nominal gain is real, and if you're tracking your home's sale price alone, it's the best reading you've seen in months. But sale price isn't the same thing as what that price can actually buy you, which is the number that matters if you're deciding whether to tap equity, sell, or hold.
Why 1.5% isn't actually a gain
June's inflation ran at 3.5%, roughly two percentage points above the 1.5% nominal home price gain. That gap is what "real" home values means: your home's price in dollars minus what those dollars have lost to inflation over the same period. According to S&P Dow Jones Indices, June marked the 13th consecutive month that real, inflation-adjusted home values fell nationally, even as the nominal, dollar-denominated index kept posting gains most months along the way.
Run the math on a concrete number. Say your home was worth $400,000 a year ago. A 1.5% nominal gain puts today's price at $406,000. Deflate that back to a year ago's purchasing power by dividing by 1.035 (June's 3.5% inflation), and you get about $392,300, a real loss of roughly $7,700, or just under 2%, almost exactly matching the gap S&P Dow Jones Indices cited. Your home is worth more money. It is not worth more, in the sense of what that money can actually buy you a year later.
So what this means for you: if you've been reassured by a rising nominal price on your own home's estimate, run the same deflation math before you treat that number as real progress. Thirteen months of this pattern means it's the rule right now, not the exception.
Chicago broke the pattern. Did your metro?
The national figure hides a regional split wide enough to matter for anyone tracking a specific city, not the country. Chicago posted the largest annual gain of any of the 20 Case-Shiller metro areas in June at 6.9%, its fourth consecutive month in the top spot, followed by New York at 4.8% and Cleveland at 4.1%. At the other end, Seattle fell 2.0% year over year, the weakest reading of the 20 cities tracked, followed by Las Vegas at -1.9% and Denver at -1.2%. That's a nearly nine-percentage-point spread between the strongest and weakest metro in the same month's data, and per S&P Dow Jones Indices, it reflects a multi-year pattern of Northeast and Midwest markets regaining strength while several Western and Sun Belt metros soften, not a one-month blip.
| Metro | June 2026 YoY |
|---|---|
| Chicago | +6.9% |
| New York | +4.8% |
| Cleveland | +4.1% |
| U.S. National | +1.5% |
| Denver | -1.2% |
| Las Vegas | -1.9% |
| Seattle | -2.0% |
Run the same real-terms math on Chicago specifically. A $400,000 home there a year ago, up 6.9% nominally, is worth $427,600 today. Deflated by June's 3.5% inflation, that's about $413,100 in a year-ago's purchasing power, a genuine real gain of roughly $13,100, or about 3.3%. Chicago is one of the few major metros where the nominal gain is large enough to actually outrun inflation this year, not just look good on paper next to it.
So what this means for you: whether you're in the group still losing real value or the smaller group of metros like Chicago that are actually ahead of inflation depends entirely on where you own, not on the national headline. Pull your own metro's Case-Shiller or ZHVI reading before you assume the national 1.5% figure describes your specific equity position.
Prices are already above the 2022 peak
Here's the part of the release that gets less attention than it should: nationally, home prices in nominal dollar terms are no longer just recovering toward the 2022 boom-era peak, they've already blown past it. The National Index sits 9.3% above its June 2022 peak as of June 2026, while the 20-City and 10-City Composites are 9.9% and 13.0% above their respective peaks. None of that is adjusted for inflation. It's the same story as the headline 1.5% figure, just compounded over four years instead of one: a genuine nominal record sitting on top of a real decline that's persisted for over a year.
So what this means for you: don't let "prices are near their 2022 peak" talk from friends or listing agents imply prices are merely catching back up. Nationally, they've already exceeded it in dollar terms, even while real purchasing power keeps eroding underneath that record.
What this means for your rate decision
Freddie Mac's Primary Mortgage Market Survey held the 30-year fixed at 6.66% as of August 27, 2026, unchanged for a fifth straight day at publication, with the next official reading due Thursday, September 3. Separately, prediction markets moved fast into the Federal Reserve's September 15-16 meeting: hike odds jumped as high as 56% and cut odds sit near 1%, according to Kalshi and Polymarket data from September 1, 2026. On a $200,000 loan at 6.66%, principal and interest runs about $1,285 a month; on $400,000, about $2,570.
Put those two data points together and the math points toward acting rather than waiting if you're sitting on real equity gains, particularly in a metro like Chicago where this year's appreciation has actually outpaced inflation. A rate cut isn't priced in before the Fed meets, and hike risk is rising, not falling, so there's no rate-driven reason to delay a decision to check your loan-to-value, shed PMI, or explore a cash-out refinance against genuine equity. Frankly, if your metro is one of the ones still posting a real loss, like Seattle, Las Vegas, or Denver, the calculus is different: your paper gain is smaller than it looks, and there's less real cushion to tap. Before you act on either scenario, understand what actually drives your rate offer, whether canceling PMI is realistic at your current equity position, and how a rate lock actually gets priced before you commit to a refinance based on a nominal number alone.