 Property
You've been refreshing the same Nashville listing for three weeks, and every rate headline you read says 7.03%. So you plug 7.03% into a calculator, see a payment that squeezes under your budget, and start planning a Saturday tour. That number is real. It just isn't the one a lender is about to quote you.
Freddie Mac's 7.03% (September 24, 2026) describes a borrower putting 20% down with good-to-excellent credit. The typical first-time buyer puts down 10% (NAR Profile of Home Buyers and Sellers, November 2025), and a buyer with a 700-something score and 10% down lands closer to 7.3%, plus mortgage insurance. On the $429,100 national median price (NAR, August 2026), that difference is about $371 a month, or 14.4% more than the headline math says.
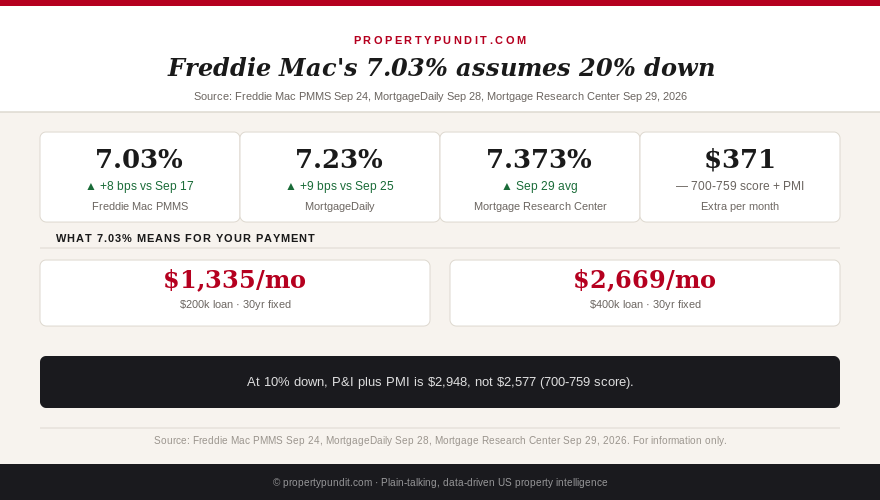
Three separate sources put the 30-year rate at three different levels this week, and none of them is wrong. Each measures a different borrower on a different day. Once you know which one applies to you, you can budget with a number that survives contact with a real Loan Estimate.
Get this in your inbox every Friday.
One email. The number that matters and what it means for you.
What Freddie Mac's 7.03% actually measures
The Primary Mortgage Market Survey pulls rates from thousands of applications that lenders submit through Freddie Mac's Loan Product Advisor each week. It counts only conventional, conforming purchase loans on owner-occupied, single-family homes, with a 20% down payment (80% loan-to-value) and good or excellent credit (Freddie Mac PMMS methodology page, September 2026). It also doesn't report points or fees, because lenders aren't always required to provide them. The survey describes a cheap, common borrower profile without saying what it cost to get that rate. That makes it a solid benchmark for tracking direction (the 30-year rose from 6.95% to 7.03% in the week to September 24, and was 6.30% a year earlier) and a poor budgeting tool for anyone who isn't that borrower. Start your budget from the rate a lender would quote you, not the rate an index reports for someone else.
Why daily trackers run 20 to 34 basis points higher
MortgageDaily.com put the 30-year at 7.23% on September 28, up 9 basis points from Friday's 7.14%. The Mortgage Research Center's daily conventional average, reported by Fortune, read 7.373% on September 29. The Mortgage Bankers Association's weekly survey showed a 7.12% contract rate for the week ending September 18. Against Freddie Mac's 7.03%, the daily trackers sit 20 and 34 basis points higher. Part of that gap is timing: rates climbed over the weekend, while the PMMS is a Thursday snapshot built from the prior week's applications. Part of it is who gets counted, since trackers blend quotes across borrower profiles instead of isolating the 20%-down, top-credit case. Use the daily numbers when you're deciding whether to lock today, and use the PMMS when you're tracking the trend over months. Comparing a PMMS figure to a lender's quote is like comparing a sticker price to an out-the-door price.
What your credit score band adds to the rate
The gap between the headline and your quote depends heavily on where your score sits. A myFICO sample of 30-year APRs on a $378,384 average loan (Mortgage Bankers Association, April 2026), published in May 2026, shows how quickly the price climbs as scores fall. The levels are from a lower-rate month, so treat the gaps, not the rates, as the useful part.
| FICO band (myFICO sample) | Sample APR, May 2026 | Gap to top band | Applied to 7.03% base |
|---|---|---|---|
| 760-850 | 6.70% | baseline | 7.03% |
| 700-759 | 6.95% | +0.25 pts | 7.28% |
| 680-699 | 7.07% | +0.37 pts | 7.40% |
| 660-679 | 7.11% | +0.41 pts | 7.44% |
| 640-659 | 7.21% | +0.51 pts | 7.54% |
| 620-639 | 7.36% | +0.66 pts | 7.69% |
The jump from the top band to 700-759 costs 25 basis points, and the jump to 620-639 costs 66. Lenders use their own band cutoffs, so ask yours exactly where the next one starts, because a score that's five points short of a cutoff can cost more than a point of down payment. If your score is within striking distance of a band, that question is worth an afternoon.
The worked example: a $429,100 home with 10% down
Take the August 2026 national median existing-home price of $429,100 (NAR). Ten percent down is $42,910, which leaves a $386,190 loan. Here's the principal-and-interest payment at 7.03% and at each band's rate, using the gaps above applied to today's baseline.
| Borrower | Rate | P&I | Extra per month | Extra over 5 years |
|---|---|---|---|---|
| Headline (PMMS, top credit) | 7.03% | $2,577 | n/a | n/a |
| Score 700-759 | 7.28% | $2,642 | +$65 | +$3,915 |
| Score 680-699 | 7.40% | $2,674 | +$97 | +$5,807 |
| Score 660-679 | 7.44% | $2,684 | +$107 | +$6,440 |
| Score 640-659 | 7.54% | $2,711 | +$134 | +$8,026 |
| Score 620-639 | 7.69% | $2,751 | +$174 | +$10,416 |
A 700-759 borrower pays $65 more each month than the headline suggests and about $3,915 over five years, before anything else is added. A 640-659 borrower pays $8,026 over the same stretch. The payments aren't dramatic in any single month, which is exactly why buyers underestimate them.
Then comes mortgage insurance. With 10% down, conventional PMI applies until you reach 78% to 80% of the original value. At roughly 0.95% a year for a 700-719 score (the figure used in our FHA versus conventional comparison), PMI adds about $306 a month on this loan. Add it to the 7.28% payment and you get $2,948 a month against the headline $2,577, a gap of $371 that never shows up in a rate headline. Compare every house you tour at that payment, not the headline one.
The payment to budget, as a share of your income
Take a $112,000 salary, which is $9,333 a month before tax. The headline P&I of $2,577 looks like 27.6% of gross income, comfortably under the 28% guideline lenders often use for housing costs. The real P&I plus PMI, $2,948, is 31.6% of gross income, and that's before a dollar of property tax or homeowners insurance, both of which the 28% guideline includes. To hold P&I plus PMI at 28% ($2,613 a month) at those terms, the loan would need to shrink to about $342,000, which means a purchase price near $380,000, roughly $49,000 below the median. If your target list is built on 7.03% math, it's likely built about $49,000 too high.
Three moves that shrink the gap
First, collect at least three Loan Estimates on the same day. Credit inquiries for the same loan type inside the shopping window count as one, as we covered in our rate shopping breakdown. Brokers beat bank quotes about 72% of the time by an average of 0.23 percentage points (mortgage-info.com, 2026), which on this loan is worth about $60 a month. Second, ask where your score band ends, and if you're close, look at a rapid rescore (see how one buyer moved from 640 to 720). Third, price an FHA loan next to the conventional one. LendingTree's September 2026 comparison found FHA quotes around 6.775% against 7.115% conventional, a 34-basis-point edge, though FHA charges 0.55% a year in mortgage insurance for the life of the loan when you put down under 10%. Each move takes a phone call, and any one of them can be worth more than waiting for a rate drop that the calendar doesn't promise.
What this means for you
Budget with 7.4% plus PMI, not 7.03%. Run your target price through that payment first, and if P&I plus PMI lands above about 28% of your gross monthly income, either lower the price target or find more down payment before you tour anything. Then shop hard: three same-day Loan Estimates, one question about your score cutoff, and one FHA quote to compare. Don't plan around a quick rate break. Traders put the odds of another quarter-point Fed hike on October 28 at roughly 70% to 72.5% (CME FedWatch, reported by Yahoo Finance), with the August PCE inflation report due September 30 and the September jobs report due October 2. A buyer who has already stress-tested the 7.4% payment can act on a good house. A buyer relying on 7.03% will find out at the Loan Estimate.