 Property
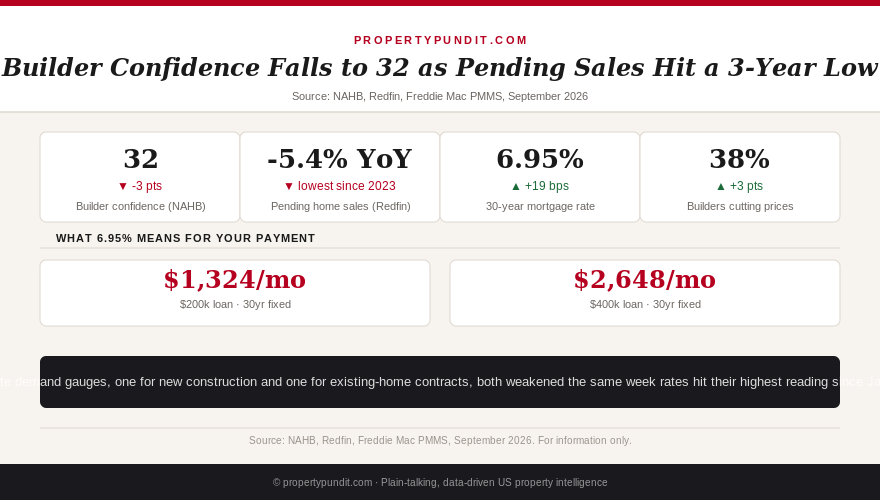
If you have been watching builder incentives pile up outside a new-construction site, or wondering why your own listing agent keeps bringing up price cuts before you do, the number behind both just landed colder than expected. Thirty-two. That is where the National Association of Home Builders' confidence index sits this month, and the trade group's own chief economist called it the weakest reading since September 2025. The same week, Redfin's pending home sales tracker slid to its lowest point in nearly three years. Two separate surveys, measuring two different corners of the market, new construction and existing-home contracts, landed on the same conclusion within days of each other: demand is cracking under the weight of a mortgage rate that just touched its highest official reading since January 2025.
What actually broke this week
The NAHB/Wells Fargo Housing Market Index fell three points to 32 in September, down from August's 35, according to the trade group's September 16, 2026 release. Current sales conditions dropped four points to 35, six-month sales expectations fell six points to 37, and prospective buyer traffic held flat at 23, a level low enough that most builders describe walk-in demand as poor rather than fair. NAHB Chairman Bill Owens put it plainly: "Buyer traffic has weakened across much of the country, largely due to rising mortgage rates." Regionally, the Northeast absorbed the sharpest hit, down five points to 39, while the West ticked up a point to 28, the only region moving the right direction. Four days earlier, Redfin's weekly tracker showed pending home sales down 3.5% from the prior four-week period and down 5.4% year over year for the four weeks ending September 13, 2026, the softest reading since late 2023.
One distinction worth keeping straight: pending sales measure signed contracts, not closings. A pending-sales drop today is a leading indicator; it shows up in closed-sale figures, like NAR's monthly existing-home sales report, roughly one to two months later, because a financed purchase typically takes 30 to 45 days to close. So the softness Redfin logged for the four weeks ending September 13 hasn't fully shown up in official closed-sale data yet; expect NAR's next couple of monthly releases to reflect it as those contracts either close or fall through. So what for you: whichever side of the market you're watching, a new-construction listing or a resale under contract, the same buyer hesitation is showing up in both, and it's not a one-week blip. It is the same rate story playing out in two separate data sets at once.
Get this in your inbox every Friday.
One email. The number that matters and what it means for you.
Builders are discounting harder than resale sellers, and that's the tell
Compare how each side of the market is responding and the gap is telling. Among the builders NAHB surveyed, 38% cut prices in September, the sixth straight month with an average cut of 6%, and 66% now offer some form of incentive, both up from August. Existing-home sellers are still deep in concession territory too, at a record 44.7% of August closings carrying some form of concession according to Redfin, the highest share for that month since Redfin's data begins in 2020, but builders are moving faster and cutting deeper because they carry a different kind of cost. A half-built spec home on a construction loan racks up interest every month it sits unsold, in a way a resale seller's already-financed home never does. That is the real signal buried in the builder-confidence number: it's not just that buyers are pickier, it's that the sellers with the least room to wait are blinking first. Worth noting: some price-cutting is normal for September, builders traditionally push fall inventory before year-end, but a 6% average cut sustained for six straight months, and an incentive-use rate that held at 63% through July and August before climbing to 66% in September, is well beyond typical seasonal discounting.
So what for you: if you're cross-shopping new construction against resale right now, assume the builder has more room, and more urgency, to negotiate than the seller down the street.
What a builder's price cut is actually worth to your payment
Run the numbers on a $450,000 new-construction listing, roughly in line with what a mid-size builder is asking in many metros this fall. September's average 6% price cut takes that home to $423,000, a $27,000 reduction. At 10% down, that shrinks the loan from $405,000 to $380,700, a $24,300 difference. At today's 6.95% rate, principal and interest on the full-price loan runs $2,680.89 a month; on the discounted loan, it drops to $2,520.04, a savings of $160.85 a month, or about $1,930 a year. That is real money, but it's worth checking against what a rate buydown of similar cost would do instead, since builders routinely offer both and most buyers only think to ask for one. So what for you: don't take the first form of concession a builder offers. Ask what the same dollar amount would do as a rate buydown instead of a price cut, because the two rarely deliver identical monthly savings for identical cost to the builder.
Which regions are actually driving the pullback
The builder confidence collapse isn't evenly spread. The Northeast absorbed the sharpest monthly drop, down five points to 39, while the South held the lowest absolute score in the country at 31, down one point, and the West posted the only regional gain, up a point to 28 from an already-weak base. That regional split lines up with what this site's own state-by-state investor underwriting has been finding all year: recent spotlights on Sun Belt and Mountain West markets, Arizona, Arkansas, California, and Colorado among them, have each found negative real-world cash flow once a genuine maintenance reserve and current insurance pricing get applied, even in markets builders and local boosters still describe as growth stories. A soft South reading and a barely-positive West reading aren't random; they track the same states where this site's investor math has been finding the least room for error for months. So what for you: if you're watching a specific Sun Belt or Mountain West market for either a home purchase or a rental, treat "still growing" headlines with some skepticism until you check the actual monthly numbers, not just the population or job-growth story.
The bigger question: what this means for where rates go next
The Fed raised its target range a quarter point to 3.75%-4.00% on September 16, its first hike in three years, and Freddie Mac's official survey put the 30-year fixed at 6.95% for the week of September 17, the highest official reading since January 2025; a daily tracker briefly touched 7.24% the day before. None of that alone is news anymore. What is new is that two demand gauges, one for new homes and one for existing contracts, both cracked in the same week the hike took effect, exactly the kind of real-economy evidence the Fed will weigh before its next meeting on October 27-28. It also means the rate lock-in effect keeping millions of owners from selling just got more expensive to break: on a $300,000 loan, the gap between a 3.8% rate from a few years ago and today's 6.95% now runs about $588 a month, up from roughly $471 a month back in May when the rate sat at 6.36%. That gap has widened by $117 a month in four months alone.
So what for you: don't expect this week's weak housing data to move the Fed on its own; the Fed watches inflation and employment first. But it does strengthen the case that rates have limited room to climb much further from here without breaking demand even more than it already has. If you're sitting on a lower rate and weighing a move, giving it up just got more expensive again, not less.
What this means for your next move
The math points toward patience over panic. If you're buying, builders currently have the most room to negotiate; use that. If you're already a homeowner deciding whether to sell and buy again, the lock-in penalty just grew, and there is no evidence this week's data is enough on its own to change that calculus before the Fed meets again in late October. Most buyers shopping seriously this fall are running new-construction and resale numbers side by side rather than picking one lane by default, precisely because the incentive gap between the two just got wider.
For the mechanics of how a rate buydown actually compares to a straight price cut, see our recent breakdown of this month's rate jump and buydown math. If you're deciding whether paying for mortgage points is worth it at all, our piece on how median homeowner tenure changes the points math is a useful next read. Our explainer on the Fed's September hike and the refinance collapse covers why rates barely moved on the vote itself. And if closing costs are the piece of a new-construction budget you haven't planned for yet, our closing costs explainer walks through exactly what to expect.