 Property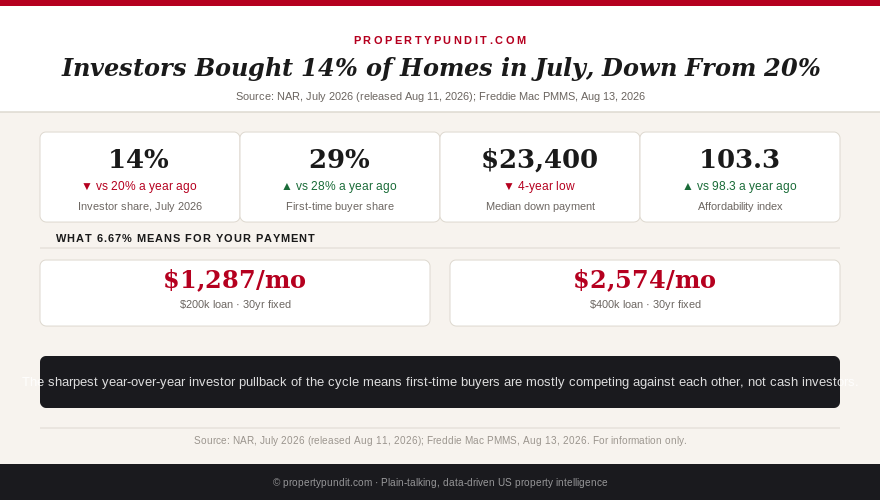
You've watched three houses in your budget go under contract in the last two months, each one faster than you could get a showing scheduled, and you've told yourself the same thing every first-time buyer tells themselves right now: an investor with cash got there first. It's a reasonable guess. It's also increasingly wrong. Individual investors and second-home buyers made up just 14% of existing-home sales in July 2026, down from 20% a year earlier, the sharpest year-over-year pullback of the entire cycle (National Association of Realtors, July 2026 existing-home sales report, released August 11, 2026).
That's not a small move. A fifth of the market shrinking to a seventh in twelve months means roughly 30% fewer investor transactions than a year ago, at a time when the national median existing-home price sits at $434,100, still up 2.0% year over year but down $6,500 from June's record ($440,600). If investors were the thing standing between you and a house, they've been quietly stepping out of the way. Something else is doing the blocking now, and it's worth being precise about what.
What the July data actually shows
NAR's July report breaks buyer type out explicitly. Individual investors and second-home buyers were 14% of transactions, up one point from June's 13% but down sharply from 20% in July 2025. Cash sales overall, a broader category that includes but isn't limited to investors, held at 26%. First-time buyers, meanwhile, were 29% of sales, down from a stronger 33% in June but still above the 28% share from a year ago. Distressed sales stayed flat at 2%, so this isn't a story about foreclosure inventory getting scooped up either.
Put the two buyer-type numbers side by side and the shift is obvious: investors shrinking, first-time buyers holding roughly steady to slightly up. If you've been assuming your competition looks like a hedge fund or a house-flipping LLC, the data says your competition mostly looks like you: another household earning somewhere in the $70,000-$120,000 range, also trying to clear a down payment, also watching rates near 6.7%. That's a different problem to solve than "outbid a cash buyer," and it changes what you should actually be doing about it.
Get this in your inbox every Friday.
One email. The number that matters and what it means for you.
Where the "investors are buying everything" myth came from
The myth isn't baseless, it's just dated. Institutional and individual investor buying genuinely spiked in 2021-2022, when near-zero rates made leveraged rental purchases cheap and rent growth was accelerating fast enough to make aggressive bidding pencil out. Single-family rental funds bought in bulk in fast-growing Sun Belt metros, and that period left a durable impression: investors as the reason regular buyers couldn't compete. The story kept circulating even as the underlying conditions that created it reversed.
Those conditions are gone. Mortgage rates near 6.7% apply to investor financing too, and a leveraged rental purchase that worked at 3% often doesn't clear breakeven at today's rates, a pattern this site's state-by-state investor underwriting keeps confirming market after market. Rent growth has also cooled in most metros, removing the second leg that made 2021-era investor math work. Cash investors, meanwhile, can now park money in a 4%+ money-market fund with zero vacancy risk and zero tenant turnover, a comparison that didn't exist when rates were near zero. The pullback to 14% isn't a blip, it's the market repricing the investor trade the same way it repriced everything else, and it means the cash competition you've been bracing for is smaller than it's been in years.
So what's actually blocking you
If it isn't investor competition, it's cash. The median first-time buyer down payment hit $23,400 in Q1 2026, a four-year low, but that figure is still a wall for a buyer earning $78,000 against a typical renter's $2,600 in savings, a gap this site has covered in detail in our look at the 20% down payment myth. The affordability index did improve to 103.3 in July from 98.3 a year earlier, and every region of the country saw gains, largest in the West at 7.3%. That's genuine progress. It just isn't the kind of progress that shows up as "investors stopped bidding against me," because they mostly weren't the ones bidding against you to begin with, not at your price point.
Where investor activity is concentrated matters too. Individual investors skew toward cash purchases in the $150,000-$300,000 range in secondary and tertiary metros, not the $350,000-$450,000 starter-home band where most first-time buyers with $70,000-$100,000 incomes are shopping. A buyer in that band was competing against other first-time buyers and existing homeowners trading up well before this year's pullback, and that competition hasn't gone anywhere. Knowing your actual competitor changes your strategy: outbidding a cash investor is close to impossible without paying cash yourself, but competing against another financed first-time buyer is a game you can win on a stronger pre-approval and a clean, well-structured offer.
The math for a $78,000 first-time buyer
Here's what actually determines whether you can compete, run for a buyer earning $78,000, the income this site uses as its baseline first-time-buyer scenario. The standard 28% front-end rule caps a sustainable monthly housing payment around $1,820. At the national median of $434,100 with 6.67% financing, that budget doesn't work even with a 20% down payment, which is exactly why "the median" is the wrong number to anchor on. Run the same $1,820 ceiling against a $227,600 purchase price with 5% down: a $216,220 loan carries roughly $1,391/month in principal and interest, property tax near $209/month at a typical 1.1% effective rate, insurance around $130/month, and PMI near $90/month on the smaller down payment, totaling close to $1,820. That's the real target price for this income and this budget, not the $434,100 headline figure, and it's over $200,000 below the national median.
No investor pullback changes that arithmetic. What does change it is finding inventory at that price point, which increasingly means secondary metros, older housing stock, or homes needing light work, exactly the segment where first-time buyers, not investors, make up most of the competition. Knowing your real target price before you start touring homes is the difference between wasting weekends on $400,000 listings you were never going to qualify for comfortably and building a realistic offer strategy around what actually fits your income.
What this means for your search
The practical shift is this: stop budgeting emotional energy for a cash-investor bidding war that's statistically less likely than it was a year ago, and put that energy into the two things that actually move your odds, closing the down payment gap and tightening your offer. Down payment assistance programs, which we've covered in detail here, cover far more of a typical first-time purchase than most buyers assume, and stacking a 3% conventional loan with a regional grant can close most of that $23,400 gap without years of additional saving. On the offer side, understanding your full closing cost picture before you write an offer means you can move faster and with more confidence than a buyer who's still doing that math during a five-day option period.
The math points toward treating this as a first-time-buyer market, not an investor-versus-you market, because that's what the data says it's become. If you've been waiting for institutional buyers to get out of the way before you make a serious run at a house, they already have. Most people who run these numbers end up refocusing on the down payment and the pre-approval instead of the bidding war they were bracing for, and that's the smarter move heading into fall.