 Property
You refinanced two years ago, locked in a rate you're not touching for anything short of a real emergency, and you've made peace with the mortgage side of your finances. What you still do, more often than you'd like to admit, is check your home's estimated value and wonder whether you're close enough to real equity to drop PMI or open a home equity line without giving up the rate you're sitting on. This week handed you a genuinely strange data point to chew on. New York just posted a record median home price, and its inventory has grown for 16 straight months in a row. Every rule of thumb you've absorbed says those two numbers should not move in the same direction at once. They just did, and if you own anywhere with a similar profile, that gap between the textbook and the reality is worth five minutes of your attention.
The New York State Association of Realtors reported June 2026 data on July 21: the statewide median sale price hit a record $475,000, up 8% from $440,000 a year earlier. In the same release, active listings rose 4.4% year over year, from 31,124 to 32,508 homes, marking the 16th consecutive month of year-over-year inventory growth (New York State Association of Realtors, July 21, 2026). Nationally, the backdrop looks nothing like that: the 30-year fixed mortgage rate has held at 6.55% for a second straight week (Freddie Mac PMMS, July 16, 2026), and NAR's own Pending Home Sales Index just fell 5.4% month over month to its lowest reading since January (NAR, July 16, 2026). New York is telling a different story than the country around it.
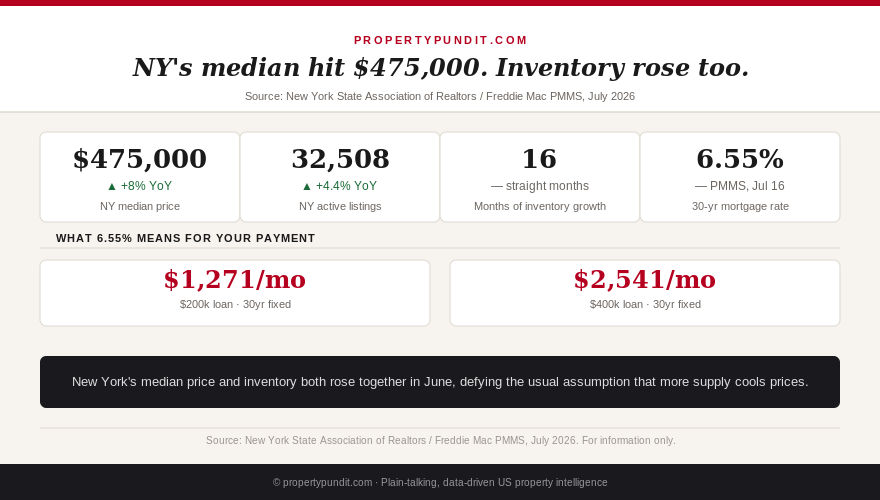
The rule you were taught, and why New York just broke it
The textbook logic on inventory is simple: when more homes hit the market, buyers get more choices, sellers compete harder, and price growth slows down or reverses. That is roughly what's happening at the national level right now. NAR's own numbers put the country at 4.6 months of supply, and Redfin has flagged roughly 47% more sellers than buyers as of this spring, both of which point toward a market tilting in the buyer's favor (NAR, Redfin, 2026). New York's own supply grew even faster than the national pace, yet its median price accelerated instead of cooling. Sixteen straight months of rising inventory next to an 8% year-over-year price gain is not a coincidence you'd predict from the standard model.
If you've been watching your own local inventory count in a listing app and assuming it alone tells you which way your market is headed, New York just proved that number is only half the story you need.
Demand grew just as fast as the supply did
The part of the report that actually explains the paradox is on the demand side. New listings in New York rose 8.8% year over year, from 15,101 to 16,426, and pending sales rose 8.1%, from 10,727 to 11,591 (New York State Association of Realtors, July 21, 2026). Supply and demand grew in near lockstep. That means the inventory build reflects more sellers testing a strong market, not sellers struggling to unload homes nobody wants. Buyers absorbed the extra listings just as quickly as they appeared, which is exactly why the price kept climbing instead of stalling.
Your own market's price direction depends on that same pairing, not on the raw inventory count by itself. A rising listing count paired with rising pending sales can still mean a seller's market; a rising listing count paired with flat or falling pending sales is the more familiar buyer's-market signal.
Get this in your inbox every Friday.
One email. The number that matters and what it means for you.
What an 8% year does, and doesn't do, for your PMI
Here's the math that matters if you bought with less than 20% down. Say you closed a year ago at $440,000 with 10% down, a $44,000 down payment and a $396,000 loan. At the national appreciation pace of roughly 1.8% to 2.2%, that home would be worth about $448,000 to $450,000 today, a gain of $8,000 to $10,000. At New York's 8% pace, the same home is worth close to $475,000, a gain of $35,000. That's real, documented equity, and it's the kind of number that makes a homeowner assume they can walk into their servicer's office and drop PMI immediately.
Not so fast. After 12 months of payments, your loan balance on that $396,000 mortgage has only come down to roughly $391,000, since early-year payments are weighted heavily toward interest. Divide that by the new $475,000 value and you get a loan-to-value ratio of about 82%, still short of the 80% threshold. Worse, the Homeowners Protection Act ties automatic PMI cancellation to 78% of your original purchase price moving through your normal amortization schedule, not a new appraisal. You can request cancellation yourself at 80% of original value, but using a fresh appraisal to prove appreciation instead generally requires at least two years of homeownership under Fannie Mae and Freddie Mac guidelines, regardless of how much value you've added in year one. Read the full mechanics in our PMI cancellation guide before you call your lender.
If you're past that two-year mark and your local comps confirm 6% to 8% appreciation, this is exactly the moment to order a real appraisal and request cancellation. If you're still inside year one, the equity is real on paper, but the rulebook says you wait, no matter what this week's headline implies.
What this means if you don't own in New York
The same pattern showed up last week in San Francisco, Pittsburgh, and West Palm Beach, three metros where luxury demand pulled local prices up 8% to 9% while the national median moved less than 2%. New York is now a fourth data point in the same direction: a national "buyer's market" headline can sit comfortably alongside a specific state or metro doing the exact opposite. Before you assume rising supply near you means a weaker hand for the seller, or a weaker hand for you as a buyer, pull your own state Realtor association's release or your local MLS's pending-sales figures side by side with the new-listings count. If your down payment math is still tight, it's also worth rereading the actual minimum down payment rules and the credit score thresholds that shape your rate, since neither one moves just because a neighboring state posted a record.
One more thing rising values quietly drag along with them: your property tax escrow. If your county reassesses anywhere close to a home's new market value, a fast-appreciating market like New York's can mean your escrow payment jumps well before your mortgage payment ever would. Our escrow shortage explainer walks through why a "fixed" rate doesn't mean a fixed monthly payment.
How to actually run this check yourself this month
You don't need to pay for a full appraisal just to get a rough answer. Start with your county assessor's site, which often lists recent sale prices for your street and the surrounding few blocks, then cross-check against three to five closed sales, not active listings, from the last 90 days within a half mile of your home, adjusting for square footage and condition. If those comps land near 6% to 8% or higher, that's a strong enough signal to justify the cost of a real appraisal or an automated valuation model from your lender. If they land closer to 2% to 3%, save the money and simply keep tracking your loan balance against your original purchase price for now.
Pair that comp check with the same two-number pairing that explained New York's paradox in the first place: pull your local new-listings count and your local pending-sales count for the last three to six months, both available from most state Realtor associations and many MLS public data pages. If pending sales are rising as fast as new listings, or faster, treat any rising inventory count you see nearby as a sign of a strong market absorbing supply, not a softening one. If new listings are climbing while pending sales stay flat or fall, that's the more familiar signal that leverage is shifting toward you as a buyer or away from you as a seller.
One more number worth pulling before you call your lender: how much of your loan balance you've actually paid down, not just how long you've owned the home. A borrower two years into a 30-year mortgage has usually retired only a small share of the original principal, since early payments are weighted heavily toward interest, the same math that kept our hypothetical New York buyer at 82% LTV after 12 months despite $35,000 in paper equity. Ask your servicer for your current payoff balance, divide it by your best current home value estimate, and you'll have the actual figure that decides whether this week's headline is good news for you specifically or just an interesting story about someone else's ZIP code.
The math points toward checking your own comps, not the headline
Most people who see a record price assume it applies evenly to every home in the state, and it almost never does. The math here points toward a specific two-step check before you act on anything: pull three to five closed comparable sales from the last 90 days within a half mile of your address, then divide your current loan balance by that number, not by a statewide average. If that ratio clears 80% and you've owned for at least two years, this is your window to request PMI cancellation or price out a cash-out refinance despite rates still sitting at 6.55%. If either condition isn't met yet, frankly, the headline is more useful to you as a reminder to keep tracking your numbers than as a reason to call your lender today.