You checked rates on Tuesday and saw 6.49%. You checked again on Wednesday afternoon and saw 6.6%. By Thursday morning, July 2, rates had pulled back to 6.51% — all before you had finished your coffee. If you are tracking rates for a refi decision or trying to nail the lock timing on a purchase, this week's volatility is exactly the kind of thing that makes people freeze. Here is what actually happened, and what it means for your specific situation before the July 30 FOMC meeting.
The short answer: the June jobs report landed Thursday morning, July 2, one business day earlier than usual because July 4 falls on a Saturday and the observed federal holiday is Friday, July 3. The BLS moved the Employment Situation release to 8:30 AM ET today. That one scheduling quirk compressed what is normally a week of anticipation into 48 hours of noise — and the noise is largely over now.
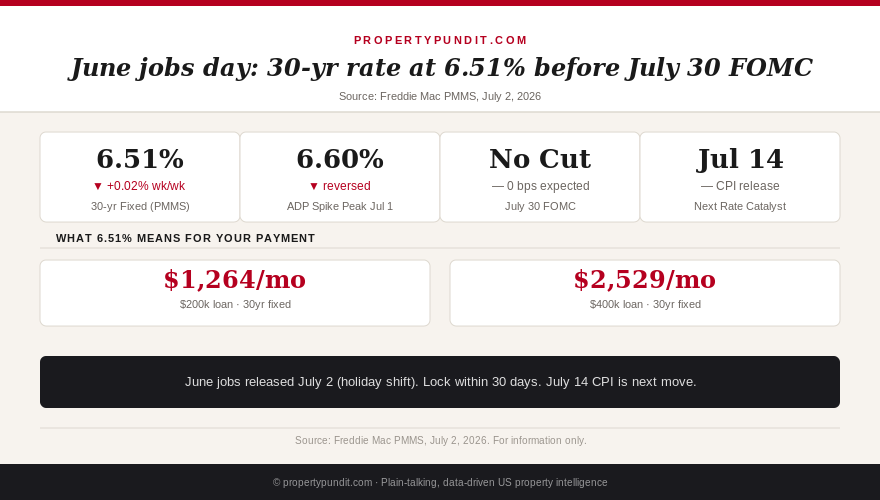
Freddie Mac's Primary Mortgage Market Survey published this week at 6.51%, up 2 basis points from last week's 6.49% (Freddie Mac PMMS, July 2, 2026). For context: rates have been in a tight band between 6.47% and 6.53% for eight consecutive weeks.
Get this in your inbox every Friday.
One email. The number that matters and what it means for you.
Why rates jumped to 6.6% on July 1
On Wednesday July 1, ADP released its private-sector payroll estimate for June, showing stronger job growth than economists had forecast. ADP does not move rates directly — it is not the official figure — but bond traders use it as an early signal for what the Bureau of Labor Statistics will report 24 hours later. When the ADP print came in above expectations, the 10-year Treasury yield ticked up, and mortgage rates followed within hours.
The mechanism matters for anyone making rate decisions. Mortgage rates track the 10-year Treasury yield, not the federal funds rate. The Fed controls overnight borrowing costs between banks. What you pay on a 30-year mortgage depends on what institutional investors demand to hold 10-year government debt — and that demand shifts in real time based on inflation and employment data. A strong jobs report signals a healthy economy, which reduces the probability of Fed rate cuts, which pushes bond yields higher, which raises your mortgage rate. The same sequence works in reverse: weak jobs data suggests the economy is softening, the Fed becomes more likely to cut, bond yields fall, and mortgage rates follow.
Thursday's BLS report for June came in close enough to expectations — roughly in line with the 115,000 forecast — that the extreme move higher was not sustained. Rates pulled back from 6.6% to 6.51%, essentially re-anchoring near where they were before the ADP surprise. The net result of the week: up 2 basis points from last Thursday's PMMS. Not a dramatic shift. But if you were watching the intraday moves, it felt chaotic.
The so-what for you: one week of employment data is not a trend. What matters to your mortgage rate for the rest of summer is whether June's jobs figure becomes a pattern. One month of modest growth at 115,000 is not the kind of consistent strength that prevents the Fed from eventually pivoting. But it does not suggest a pivot is imminent, either.
What the July 30 FOMC means for mortgage rates
The Federal Open Market Committee meets July 30, 2026. Markets are pricing zero probability of a rate cut at that meeting. The CME FedWatch tool shows the overwhelming consensus is that the Fed holds at 3.50–3.75% through at least September 2026. Kevin Warsh, who took over as Fed Chair in January, has been consistently hawkish — his June 17 press conference removed the easing bias from the Fed's forward guidance entirely, signaling that the next move could just as easily be a hike as a cut.
What this means for mortgage rates: the July 30 meeting is unlikely to produce any direct catalyst for rates to move meaningfully lower. The bond market has already priced in the hold. The variable that actually could move rates before July 30 is the July CPI report, due July 14. If June inflation prints above 0.3% month-over-month, expect rates to push back toward 6.6% or higher. If it comes in at 0.2%, rates could drift to 6.35–6.45% — meaningful savings on a large loan.
On a $400,000 loan, the difference between 6.35% and 6.6% is about $66 per month or $790 per year. That is real money, but it is also not the kind of gap that should freeze a decision you have already made. If you need to close in July or are holding a rate lock that is expiring, the relevant question is not "when will rates fall?" but "what is my breakeven if I wait?" You can use the PropertyPundit mortgage calculator to run the comparison for your specific loan size.
The so-what for you: the July 30 FOMC meeting is priced. Unless the July 14 CPI report dramatically undershoots expectations, rates will stay in the 6.45–6.60% band through the end of July.
The holiday week rate dip: real or noise?
Every year, there is a question about whether the week of July 4 produces a meaningful rate dip. The theory: lower trading volumes during the holiday week reduce liquidity, bond prices drift higher (yields drift lower), and mortgage rates tick down. In practice, the dip is typically modest — 3 to 8 basis points — and reverses within a week when full trading resumes.
This year, the jobs report timing makes the picture clearer than usual. The big data release already happened today. The jobs number is not a shock. With the bond market closing early on Thursday (July 3 is the observed holiday) and fully closed Friday, there is very little new information to move rates over the long weekend. If rates drift at all, it will be by a few basis points in either direction — not the kind of move that changes a lock decision.
Anyone who was hoping for a significant holiday-week rate drop to finally make their refi math work is going to be disappointed. The rate drop that unlocks refinancing for most 2020–2021 buyers — call it sub-5.5% — requires either a major inflation surprise or a Fed that starts cutting, neither of which is on the horizon for July 4 weekend.
The so-what for you: the holiday-week dip is noise. Do not make a rate-lock decision based on what rates might do between July 3 and July 7. The meaningful next catalyst is July 14 CPI.
Lock or float: the decision framework by closing date
Here is the framework for the question most buyers and refinancers are actually asking.
Closing within 30 days (by early August): Lock now. The July 30 FOMC meeting is not going to cut rates, and the July 14 CPI has as much chance of pushing rates up as down. Floating from 6.51% to capture a potential 3–8 basis point dip is not worth the risk of a 15–20 basis point spike if CPI surprises to the upside.
Closing 30–60 days out (August to mid-September): Consider a float-down option if your lender offers one. Most float-down products allow you to capture a lower rate if rates fall by at least 25 basis points before close. The cost is typically 0.125–0.25% in points upfront. On a $350,000 loan, the break-even calculation for a float-down: if rates fall 25 basis points, you save about $56 per month. If you plan to stay in the home six or more years, the float-down pays for itself. If you are planning to sell or refi within five years, pay the lower points instead.
Closing 60-plus days out: Float with a defined trigger. Set an alert for the rate that changes your decision — for most refinancers who bought in 2021–2022, that break-even is somewhere around 6.0–6.25%. If rates hit your trigger before you close, lock immediately. If they do not hit it by 45 days before closing, lock regardless.
The five-rate triggers article published June 20 on this site gives the precise break-even numbers by original purchase rate. If you bought in 2024 at 6.75% or above, the 5 mortgage rate triggers article shows you exactly what rate makes refinancing worth the closing costs. If your 2021 ARM just reset and you are weighing a refi against holding another year at a potentially higher reset, the ARM reset payment math article shows the year-by-year comparison.
What the rate environment actually tells you about buying now
The broader picture heading into the second half of 2026: the 30-year fixed rate has been above 6.0% for 30 consecutive months. Every month it stays there, more buyers accept that 6% rates are the new baseline rather than a temporary aberration. That shift in psychology is showing up in the data — May existing home sales rose 3.2% year-over-year to 4.17 million annualized, with first-time buyers at 35% of all sales, the highest share since June 2020 (NAR, June 2026).
Buyers are not waiting for sub-5% rates anymore. They are buying at 6.5% because wages have risen, inventory is up, and 47% more sellers than buyers nationally means the negotiating power that did not exist in 2021–2022 is very much available now (Redfin, May 2026). The math on a conventional loan with PMI that cancels at 80% LTV is meaningfully better than the math on continuing to rent in most markets.
The frankest statement you will read anywhere: rates at 6.51% are not a reason to delay a purchase decision if your finances, employment, and local market conditions support buying now. The risk of waiting for a 5.5% rate — which requires at minimum a 2027 Fed pivot — is that home prices in supply-constrained markets continue rising at the 2–6% pace that has persisted through the entire high-rate environment. In 23 major US cities, buying already costs less per month than renting. That number grows as rents keep rising and buyers gain negotiating power.
The math points toward this conclusion for most buyers who have adequate reserves and a 5-plus-year horizon: the rate you get today matters less than the price you pay. Negotiate hard on price while the concession window is open. Refinance when rates fall. The opportunity to be in the 47%-more-sellers market is worth more than the option value of waiting for a rate that may not arrive in 2026 at all.