 Property
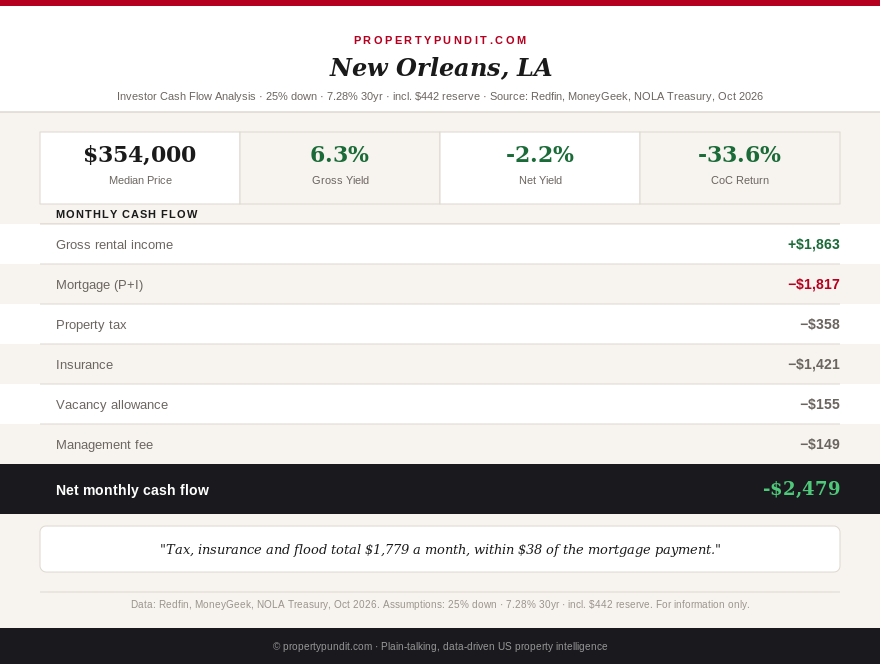
You're sizing an $88,500 down payment on a median New Orleans house, and the lender quotes 7.28%. The mortgage payment is the part you can calculate on a phone: $1,817 a month in principal and interest. The part that decides whether you can hold the house is everything else. Property tax, insurance and flood coverage add up to $1,779 a month on a $354,000 house, within $38 of the loan payment itself, and the house still loses about $2,479 a month after management, vacancy and a maintenance reserve.
This is our third pass on Louisiana, after the June 6 first pass and the July 28 second pass. The benchmark has moved: Freddie Mac's 30-year fixed rate reached 7.28% on October 1, 2026, up from 6.58% when the second pass ran (Freddie Mac PMMS, October 1 and July 23, 2026). I underwrote each market with 25% down, an 8% management fee, one month of vacancy a year and a 1.5% annual maintenance reserve, the same method as our other third-pass states, and I re-sourced price, rent and insurance for all three cities.
Get this in your inbox every Friday.
One email. The number that matters and what it means for you.
New Orleans: insurance is the line that broke the model
Price first, because three sources give three answers. Redfin put New Orleans at $354,000 for the three months ending May 2026, up 5.7% year over year (Redfin, May 2026). The New Orleans Metropolitan Association of Realtors reported an August metro average sales price of $369,344, up 8.7%, on 1,071 closed sales (down 3.2%) and 64 days on the market, with an Orleans Parish average of $493,953, up 16.4% (NOMAR, September 12, 2026). Those are averages, which high-end sales pull up, so I stayed with the $354,000 median. Redfin's city-level median for December 2025 was only $290,000 (Stacker/Redfin, December 2025), a reminder of how far the figure moves with the window and the boundary.
Insurance is the bigger story. In the July pass I used $207 a month, from a landlord-policy figure of $2,224 to $2,484 a year. This time I pulled three fresh sources: MoneyGeek puts the New Orleans average at $12,248 a year, or $1,021 a month, in a state where the average is $7,304, the third highest in the country (MoneyGeek, 2025); Insurify's New Orleans average is $13,836 a year for a $300,000 policy (Insurify, 2026); and the Insure.com landlord-policy figure from July, which I had flagged as an outlier, was as high as $9,251. All three are several times the $2,484 I used. MoneyGeek and Insurify are owner-occupied averages, so get a bound landlord quote before you rely on mine. I used MoneyGeek's $1,021, kept flood at $400 a month for a high-risk zone (a Zone X lot runs $125 to $250), and the result is a coverage ratio of 0.52.
Property tax moved too. Louisiana assesses residential property at 10% of market value, and New Orleans' citywide total millage is 121.20 (City of New Orleans Treasury, October 2026), which works out to a 1.21% rate on a rental: $4,291 a year, or $358 a month, on $354,000. The July pass used 0.88%, so it understated this line by about $100 a month. Millage varies by taxing district inside the city, so confirm the rate for the specific address. Owner-occupants get an exemption on the first $75,000 of market value, worth $909 a year on this house, and landlords can't claim it. What it means for you: don't price a New Orleans deal until you've seen the actual flood zone determination and an insurance quote, because those two lines alone are $1,421 a month.
| Monthly line item | New Orleans | Baton Rouge | Shreveport |
|---|---|---|---|
| Median price | $354,000 | $275,276 | $237,904 |
| Rent (3-bedroom house) | $1,863 | $1,600 | $1,300 |
| Principal and interest (25% down, 7.28%) | $1,817 | $1,413 | $1,221 |
| Property tax | $358 (1.21%) | $161 (0.70%) | $149 (0.75%) |
| Insurance (wind, hail, fire) | $1,021 | $372 | $320 |
| Flood (separate policy) | $400 | $200 | $50 |
| Management (8%) | $149 | $128 | $104 |
| Vacancy (one month a year) | $155 | $133 | $108 |
| Maintenance reserve (1.5% a year) | $442 | $344 | $297 |
| Net monthly cash flow | -$2,479 | -$1,151 | -$949 |
| Coverage ratio (rent / PITIA) | 0.52 | 0.75 | 0.75 |
| Break-even rent | $4,826 | $2,975 | $2,435 |
Baton Rouge: a third of the swing is my price source
Baton Rouge's price needs an honest explanation. The July pass used $224,000 from Zillow's ZHVI, a value index across the whole housing stock. Redfin's sale-price figures run higher: $270,379 for the first quarter of 2026, up 1.7% (Redfin, Q1 2026), and $275,276 for January through June, up 3.2%, with 58.1 days on the market, up 1.1 days (Redfin via Stacker, mid-2026). I switched to the actual-sales figure, $275,276, because that's what you pay at the closing table. Of the $982 monthly swing since July, $357 comes from that source change rather than from the market moving. On July's $224,000 price with every other new input, Baton Rouge would still lose about $793 a month.
Rent is soft: Rentometer's median for a three-bedroom house in Baton Rouge was $1,600 in April 2026, below the $1,695 I used in July (Rentometer, April 2026). Insurance is higher: MoneyGeek's Baton Rouge average is $4,460 a year, $372 a month, and Insurify's is $5,133 for a $300,000 policy (MoneyGeek, 2025, and Insurify, 2026). I used the lower MoneyGeek figure. Property tax is the one input I could not re-verify this pass: I carried 0.70% for East Baton Rouge Parish from the July pass, so treat the $161 a month as unconfirmed. The result is a loss of $1,151 a month, with a break-even rent of $2,975, 86% above today's rent.
The one positive case from July, a Zone X high-ground suburb such as Zachary or Central, showed +$42 a month at $224,000. Taking the flood line to zero at that same price with today's inputs gives about -$593. What it means for you: the high-ground Baton Rouge suburbs are still the least-bad Louisiana option, but they no longer cash-flow at 7.28%.
Shreveport: the rent correction is the only good news
Shreveport is the case where the correction helped. The July pass used a citywide median rent of $1,025, a figure that blends in small apartments. Rentometer's September 21, 2026 data shows a three-bedroom average of $1,270 across all property types, and three-bedroom houses sit near $1,300 (Rentometer, September 2026). Using $1,300 improves monthly cash flow by $230. This is the same blended-rent trap we've now found in several states, and it's a reminder to check the rent number for the house you'd actually buy, not the city average.
Price is $237,904 for January through June 2026, up 2.0%, with 65.3 days on market, up 3.5 days (Redfin via Stacker, mid-2026). Insurance rises to MoneyGeek's $3,845 a year ($320 a month), the cheapest of the three cities because Shreveport sits far from the coast. Even with the better rent, the house loses $949 a month because $520 of added costs (rate, maintenance reserve, price and insurance) more than offsets the $230 fix. Property tax is again the carried 0.75% estimate from July, not independently sourced. What it means for you: Shreveport has the smallest dollar loss, but it also has the weakest appreciation, 2.0%, so the loss isn't being paid back.
What changed since July, line by line
I recomputed July's figures at the same method so the comparison is clean (the published July figures were -$988, -$158 and -$653, which recompute to -$1,000, -$169 and -$659). The table below shows each change in sequence. In New Orleans, insurance alone is $814 of a $1,479 deterioration. In Baton Rouge, maintenance, price source and insurance share most of it. The rate change accounts for only $79 to $124 a month in each city, which matters: a drop back to 6.5% would trim the losses but wouldn't rescue any of these deals.
| What changed since July | New Orleans | Baton Rouge | Shreveport |
|---|---|---|---|
| July cash flow (recomputed) | -$1,000 | -$169 | -$659 |
| Rate 6.58% to 7.28% | -$124 | -$79 | -$80 |
| Maintenance reserve added | -$442 | -$280 | -$285 |
| Price source and level | $0 | -$357 | -$71 |
| Property tax re-checked | -$98 | $0 | $0 |
| Rent re-sourced | $0 | -$79 | +$230 |
| Insurance re-sourced | -$814 | -$187 | -$84 |
| Today | -$2,479 | -$1,151 | -$949 |
Is the insurance market getting better?
Yes, but slowly, and it doesn't fix the math. Louisiana's average homeowners rate change was 0.1% so far in 2026, versus 4.6% in 2025 and 6.6% in 2024, and nine of the 16 filings the Department of Insurance finalized this year cut rates (Beinsure, 2026). More than 20 new carriers have been licensed, seven of them in 2026, and Louisiana Citizens dropped to about 114,000 policyholders in June from a 2022 peak of 140,000 (Hoodline, August 2026). But many new carriers limit their footprint or exclude wind, and the same report warns that one major hurricane could reverse the gains.
Carrier spread is the lesson. MoneyGeek's quotes for comparable coverage run from $1,962 a year at Foremost to $19,660 at Louisiana Farm Bureau, a tenfold gap. Flood is a separate problem: Louisiana lost 70,000 National Flood Insurance Program policies from 2022 to 2024 after FEMA's Risk Rating 2.0 raised premiums (Environmental Health News). A buyer who skips flood to make the numbers work is taking a risk the model deliberately includes. What it means for you: get at least five insurance quotes, ask about wind exclusions, and don't make an offer without a flood zone determination in hand.
Louisiana's tax picture: a 3% income tax and a homestead break landlords don't get
Louisiana's flat 3% income tax, effective January 1, 2025, is a real advantage, and the same 3% applies to capital gains. It's smaller than the insurance line in every city here. The homestead exemption is the other quiet cost: it applies only to owner-occupied primary residences, not to rentals (Steadily, October 2026), which makes Louisiana another entry on the long list of states where the advertised property tax rate belongs to owner-occupants and the investor pays more.
The appreciation question
An investor who accepts these losses is betting on appreciation. Here's what that bet looks like at each city's recent growth rate applied to today's price.
| Appreciation vs annual loss | New Orleans | Baton Rouge | Shreveport |
|---|---|---|---|
| Recent price growth (YoY) | 5.7% | 3.2% | 2.0% |
| Appreciation on today's price | $20,178 | $8,809 | $4,758 |
| Annual cash loss | $29,748 | $13,812 | $11,388 |
| Appreciation minus loss | -$9,570 | -$5,003 | -$6,630 |
New Orleans has the fastest growth and the biggest hole: appreciation of $20,178 against a $29,748 annual cash loss. None of the three pays for itself on the figures I have.
What this means for you
If you're a Louisiana landlord or you're buying your first rental there, run the numbers in this order. Get the flood zone determination, then at least five insurance quotes, then check whether the rent you're using is for the house you'd actually own. If those three inputs come in at or below the figures above, the loss shrinks, but a $949 monthly loss in Shreveport is still $11,388 a year you need to fund from outside the property. At 7.28%, my read is that none of the three median-priced Louisiana markets makes sense for an investor who needs the house to pay for itself, and the only workable cases are a high-ground Baton Rouge suburb or a lower-priced home where your own quotes beat mine.