 Property
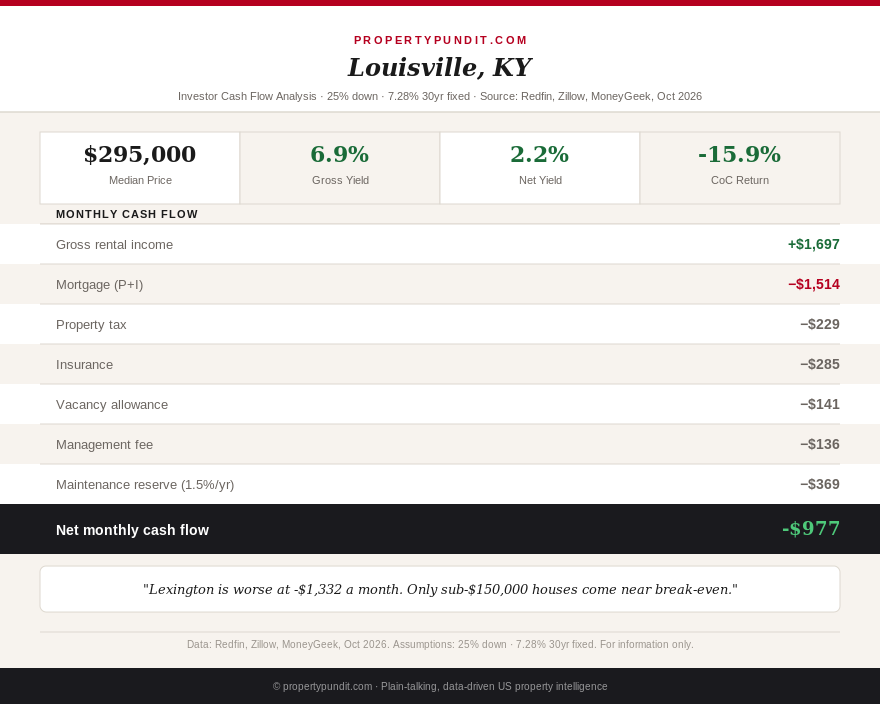
Kentucky has the reputation that a 7.28% mortgage rate makes you hunt for: cheap houses, no rent control, a 3.5% flat income tax, and a landlord-friendly legal system. If you're sizing a roughly $74,000 down payment on a median Louisville rental, the reputation is the easy part. The paycheck is the hard part: that house loses about $977 a month once you count insurance and a maintenance reserve, and a median Lexington house loses about $1,332.
This is our third pass on Kentucky, after the June 5 first pass and the July 24 second pass. The benchmark moved since then: Freddie Mac's 30-year fixed rate reached 7.28% on October 1, 2026, up from 7.03% the week before and the highest reading since November 2023 (Freddie Mac PMMS, October 1, 2026). I underwrote each market with 25% down, an 8% management fee, one month of vacancy a year, and a 1.5% annual maintenance reserve, the same method as our other third-pass states.
Get this in your inbox every Friday.
One email. The number that matters and what it means for you.
Louisville: a flat price, loose inventory, and a $977 monthly loss
Redfin put Greater Louisville's median sale price at $295,000 in May 2026, up 2.5% year over year (Redfin, May 2026). A separate Louisville market report for June shows $304,400, nearly flat against $305,000 a year earlier, with active listings up 35.4% to 4,193, months of supply up from 2.5 to 3.3, and homes taking 47 days to sell, nine days longer than last year (Hoodline market report, June 2026). The two sources disagree by about $9,400, so I used the Redfin number for the model. On the higher June number the loss grows to about $1,051 a month.
Rent is the shakiest input, so here is both sides. Zillow's single-family average for Louisville runs about $1,697 a month (Zillow, 2026). Rentometer's three-bedroom house figure is lower, $1,428 on average with a $1,350 median, but it is dated January 2026 (Rentometer, January 2026). On the Zillow rent the property loses $977 a month with a coverage ratio of 0.84. On the Rentometer rent it loses $1,202 with a ratio of 0.70. Either way you need rent of about $2,864 to break even, which is 69% above Zillow's figure.
Insurance is the other input I'm treating with care. MoneyGeek's 2026 Kentucky average is $3,029 a year for a $250,000 dwelling with a $1,000 deductible, and its quotes run from $1,768 at $100,000 of coverage to $5,162 at $500,000 (MoneyGeek, 2026). I scaled the premium to each price along that curve, which gives $3,423 a year ($285 a month) for Louisville. That may overstate the cost for a newer house with a good claims history, so get a real quote before you rely on my figure.
| Monthly line item | Louisville | Louisville (low rent) | Lexington |
|---|---|---|---|
| Median price | $295,000 | $295,000 | $342,712 |
| Rent (3-bedroom house) | $1,697 | $1,428 | $1,700 |
| Principal and interest (25% down, 7.28%) | $1,514 | $1,514 | $1,759 |
| Property tax (effective rate) | $229 (0.93%) | $229 (0.93%) | $248 (0.87%) |
| Insurance | $285 | $285 | $319 |
| Management (8%) | $136 | $114 | $136 |
| Vacancy (one month a year) | $141 | $119 | $142 |
| Maintenance reserve (1.5% a year) | $369 | $369 | $428 |
| Net cash flow | -$977 | -$1,202 | -$1,332 |
| Debt-service coverage | 0.84 | 0.70 | 0.73 |
| Break-even rent | $2,864 | $2,864 | $3,292 |
| Gross yield / net yield | 6.90% / 2.19% | 5.81% / 1.27% | 5.95% / 1.49% |
| Cash-on-cash return | -15.9% | -19.6% | -18.7% |
The tax line uses Jefferson County's roughly 0.93% effective rate and Fayette County's roughly 0.87% (Ownwell and PropertyTaxAlmanac, 2026). What it means for your decision: a Louisville house is a sound place to park equity, but at this price and rent it is an appreciation bet that has to cover a $11,724 annual loss, and 2.5% growth on $295,000 delivers only about $7,375.
Lexington: the best growth in the state and a bigger loss
Lexington's median sale price was $342,712 for January through June 2026, up 4.7% year over year, with 2.6 months of supply, 1,933 active listings (up 2.1%), and 47.8 days on market (Stacker market review, mid-2026). Redfin's three-month figure ending May was $350,000, up 5.7%, so the sources differ on both price and window, and I used the lower number. This is a tighter market than Louisville, and the national comparison makes the point: supply here is 2.6 months against about 3.9 months for the country in the same review.
Rent is where Lexington falls short. Zillow's single-family average is about $1,700 a month, reported in LEX18's August 23, 2026 coverage, which also noted that many Lexington renters were seeing monthly decreases of about $50 (LEX18, August 2026). A $1,700 rent against a $2,326 payment gives a coverage ratio of 0.73 and a monthly loss of $1,332, with a break-even rent of $3,292, or 94% above today's rent.
Here is the one place the math is closer than it looks. Lexington's 4.7% growth on $342,712 is about $16,107 a year, and the annual cash loss is $15,984. If the growth repeats, appreciation roughly covers the carrying cost before selling costs, which is a bet on price, not a rental business. What it means for your decision: buy Lexington only if you would be happy owning it with no tenant income at all.
Why July's numbers looked better than these
When I re-ran Louisville on July's inputs (a 6.58% rate, $130 a month for insurance, and no maintenance reserve), the same model gives a loss of about $349 a month. Today it shows $977. That $628 gap is worth taking apart, because the order of the pieces is not the one most readers would guess.
| Step (Louisville, $295,000) | Monthly cash flow | Change |
|---|---|---|
| July basis: 6.58% rate, $130 insurance, no reserve | -$349 | n/a |
| Add today's 7.28% rate | -$453 | -$104 |
| Add price-scaled insurance ($285) | -$608 | -$155 |
| Add 1.5% maintenance reserve ($369) | -$977 | -$369 |
The rate change from 6.58% to 7.28% costs $104 a month. Insurance repriced to MoneyGeek's coverage curve adds $155. The maintenance reserve, which this site added to its underwriting after July, adds $369 and is 59% of the swing. If the Fed engineered a drop to a 6% mortgage rate tomorrow, Louisville would still lose about $789 a month, recovering only $188. What it means for your decision: stop waiting for a rate cut to rescue a rental deal, because the reserve and the insurance bill are larger than the rate move.
Where Kentucky does pencil: sub-$150,000 houses
DSCR lenders and investor-education sites describe a tier of older B- and C-class houses from $100,000 to $175,000 outside the Louisville and Lexington cores, renting for $1,100 to $1,500 and showing gross yields of 8% to 11% (DSCR Authority and Lendmire, 2026). I don't have a sourced listing, so the table below is an illustration at $150,000 and a $1,300 rent, not a market median.
| Entry-level house (illustrative) | $150,000 house |
|---|---|
| Rent (placeholder, not a market median) | $1,300 |
| Principal and interest (25% down, 7.28%) | $770 |
| Property tax (0.83% state average) | $104 |
| Insurance (scaled) | $183 |
| Maintenance reserve (1.5%) | $188 |
| Net cash flow after management and vacancy | -$156 |
| Debt-service coverage | 1.23 |
| Break-even rent | $1,486 |
| Net cash flow if rent is $1,100 | -$323 |
That scenario clears a 1.23 coverage ratio, the first Kentucky case in this pass to do so, and loses only $156 a month. Move the rent down to $1,100 and the coverage ratio is 1.04 with a $323 monthly loss. The ratio passes a lender's test while the cash flow stays negative, because the lender's test ignores management, vacancy and repairs. An older house at this price is also where deferred maintenance hides, and MoneyGeek's data shows a 1980-built house costs about $3,789 a year to insure against $2,829 for a 2020 build (MoneyGeek, 2026).
The tax edge that doesn't change the answer
Kentucky's flat income tax fell to 3.5% on January 1, 2026, and that rate applies to rental income and capital gains alike. There is no statewide rent control, and Steadily rated the state 5 out of 5 for landlord friendliness in 2026. Those are real advantages, but they are worth tens of dollars a month, not the $977 to $1,332 gap. The homestead exemption of $49,100 in assessed value reaches only owner-occupants who are 65 or older or totally disabled, so a landlord pays on the full assessed value (Steadily, 2026).
What this means for you
If you're comparing Kentucky with a cheaper-looking state, treat the metro medians as appreciation markets and nothing more. Louisville needs about $2,864 of rent and Lexington about $3,292, against rents of $1,700 or so, so neither works as an income property today. If you still want to buy, put a price on three inputs before you make an offer: a real insurance quote, a current rent comparable from a listing near the property, and a reserve of at least 1.5% of the price a year. If the deal only works at the optimistic end of those three, pass.
If your goal is monthly income, the only Kentucky category in this pass worth underwriting further is a sub-$150,000 house, and the price you should pay is the one that makes the coverage ratio reach 1.25 at a rent you can document. Everything above that is a bet on appreciation, and Louisville's 2.5% growth does not currently cover the cost of waiting.