 Property
You've been waiting for rates to come back down since spring, and technically, they did, for about six weeks in June. Then they turned around and climbed back up through July and August, and the most recent official reading has your 30-year fixed sitting 61 basis points above where it started the year's low point. If it feels like every small dip gets erased by a bigger climb a few weeks later, that's not your imagination. That's what the data actually shows.
Six straight months of a rate mostly grinding higher is the kind of trend that should change how you're timing a purchase or a refinance, not just how you feel about reading the Thursday headline.
Six months, mostly one direction
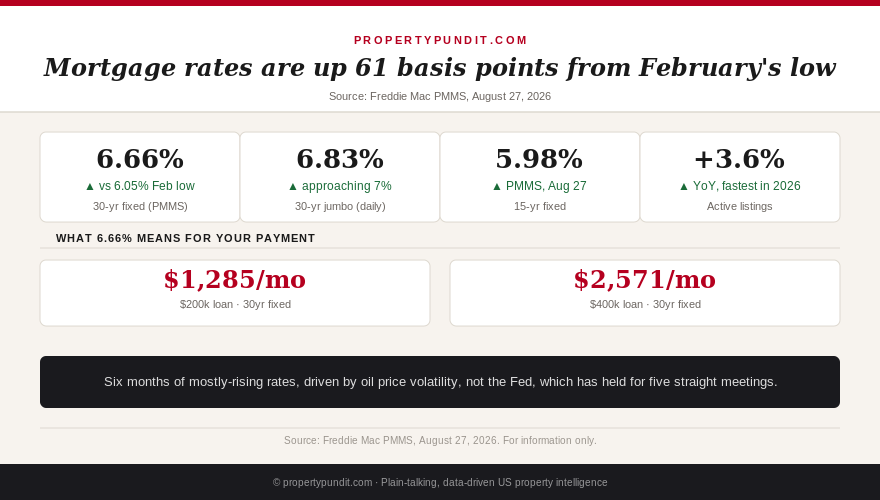
Freddie Mac's Primary Mortgage Market Survey (PMMS) put the 30-year fixed at 6.05% in late February 2026, the year's low point. It climbed sharply to 6.75% by May 21, then eased into the low 6.4s through June as pressure from the US-Iran conflict briefly cooled. July and August reversed that relief entirely: the rate ground back up week after week, hitting 6.55% on July 16, 6.58% on July 23, 6.66% on July 30, and holding at 6.66% as of the most recent confirmed reading, August 27, 2026. Today's official PMMS reading had not yet posted as this article went to press; treat 6.66% as the last confirmed figure until Freddie Mac's own site updates later today.
On a $350,000 loan, the move from 6.05% to 6.66% adds roughly $140 to your monthly principal-and-interest payment, before any change in taxes or insurance. That's not a rounding error. It's the difference between a payment that felt manageable in February and one that doesn't in September, on the exact same loan amount.
So what for you: if you've been anchoring your budget to February's rate because that's the number you remember seeing first, you're underestimating your real payment by roughly $140 a month on a typical loan, and it's worth re-running your numbers before you make an offer.
Get this in your inbox every Friday.
One email. The number that matters and what it means for you.
Why oil, not the Fed, is driving your rate
Every material rate move this year traces back to the US-Iran conflict flaring and cooling, pushing oil prices and Treasury yields around, not a shift in Federal Reserve policy. The Fed has held its target range at 3.50%-3.75% for five consecutive meetings through July 29, 2026, and its most recent vote actually saw three regional presidents dissent in favor of a hike, not a cut. Mortgage rates track the 10-year Treasury yield, not the fed funds rate directly, which is why your rate has moved by more than half a point this year even though the Fed itself hasn't moved at all.
That distinction matters for how you read the next few weeks. The Fed doesn't meet again until September 15-16, and prediction markets currently price a hold as the most likely outcome, with a hike a real possibility and a cut essentially off the table. If you're waiting for the Fed to hand you a lower rate, the market isn't pricing that outcome any time soon. The geopolitical volatility that's actually been moving your rate could ease or worsen on any given week, with no calendar to plan around.
So what for you: a rate strategy built around "the Fed will cut soon" has been wrong for most of 2026, and the more reliable planning assumption right now is that your rate moves with headlines you can't predict, not a meeting you can circle on a calendar.
Today's tracker gap: how close is 7%, really
With today's official PMMS reading still pending, daily rate trackers offer the closest live read on where things stand. As of this morning, 30-year jumbo loans were quoting around 6.83%, 30-year conventional refinance rates near 6.854%, 15-year fixed at 5.98%, and FHA loans at 6.161%, the lowest of the group thanks to government backing. None of these are the PMMS headline number, and none of them are directly comparable to each other since they cover different loan types and borrower profiles, but the direction they're all pointing is the same: closer to 7%, not further from it.
The gap between 6.66% (last week's official conforming rate) and 6.83% (today's jumbo tracker) isn't a like-for-like comparison, since jumbo loans price differently than conforming ones. But the broader pattern, official surveys running behind what daily trackers are already showing, has held for most of the summer. When that gap has closed in past weeks, it's mostly closed upward, with the official rate catching up to the tracker rather than the other way around.
So what for you: if you're shopping a jumbo loan specifically, the 6.83% tracker figure is a far more honest starting point than the conforming PMMS headline, and you should ask any lender quoting you meaningfully below that number what's different about your file.
The demand side is starting to crack too
Rate pain alone doesn't tell the whole story this week. Active listings climbed 3.6% year over year to 1,140,000 homes in August, the fastest annual growth rate the market has posted all year, and national inventory still runs about 11.1% below typical pre-pandemic levels. At the same time, the share of listings taking a price cut in August ran slightly above last year's level for the first time in 2026, and pending home sales turned negative year over year for the first time in eight months. Rising supply and softening demand moving in the same direction at once is a combination that typically hands buyers more negotiating room, even while it does nothing for the rate itself.
So what for you: more inventory and softer pending sales mean you likely have more room to negotiate on price or concessions than you did in the spring, even though the rate you'll finance that lower price at hasn't gotten any friendlier.
What this means if you're deciding whether to lock
Six months of a rate that's mostly climbed, with the two clearest declines (June and the brief easing in mid-August) both getting erased within weeks, is not a pattern that rewards waiting. If you have a rate offer at or near where today's daily trackers sit and you've shopped at least three lenders, the math points toward locking rather than floating: the trend over the last six months runs against you, the next Fed decision isn't until September 15-16 and isn't priced to help, and the geopolitical volatility driving this year's moves has no reliable calendar of its own.
If you're a homeowner sitting on a rate from a few years ago near 3.5%-4%, none of this changes your refinance math, since the gap between your existing rate and anything in the mid-6s remains too wide to close. But if you're actively house-hunting and treating "rates will come down soon" as your plan, six months of data say that plan has been wrong more often than it's been right this year.
If you're new to comparing loan offers, start with how your credit score moves your rate tier and how much you actually need to put down, since both change what rate you're quoted more than a single week's headline number does. And before you sign anything, confirm what's baked into your closing costs, since a lender advertising a rate near the low end of today's range sometimes makes it up in points and fees you won't see until the final disclosure.