 Property
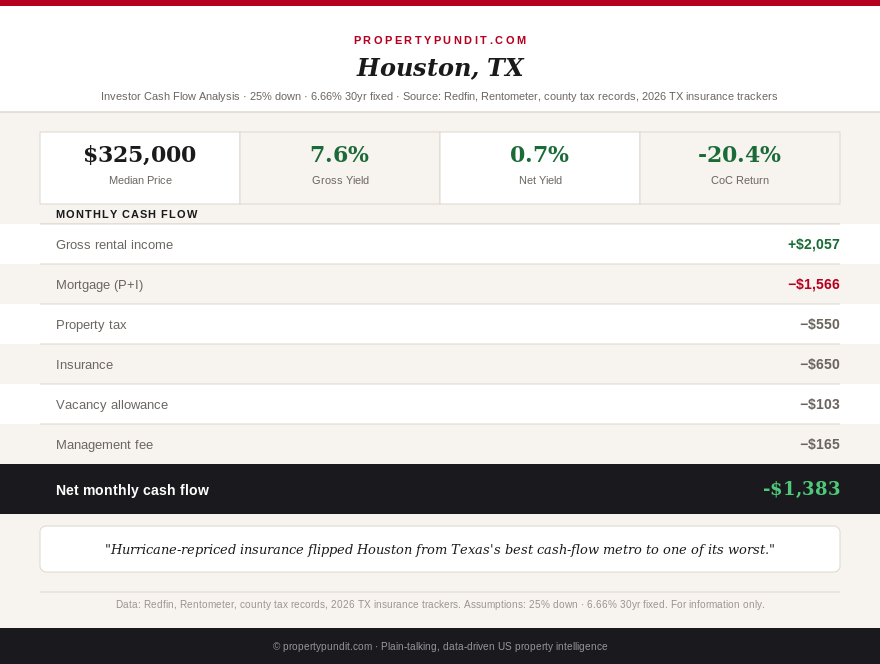
Here's a reversal worth pausing on if you've been eyeing Texas as your next rental market: Houston used to be the state's best cash-flow city. In our first-pass Texas underwrite two months ago, Houston posted the smallest monthly loss of any major metro, beating San Antonio, Dallas, and Austin. Run the same property through 2026's repriced insurance market and Houston falls to a near-tie with Dallas for the worst of the four, trailing only Austin. Nothing about the rent changed the story. The insurance bill did.
This is a second-pass update to our June 2026 Texas spotlight. Statewide, the median home price sits at $347,911 (Redfin, June 2026), down 0.17% year over year, with homes taking a median 69 days to sell, up three days from a year ago, and 5.0 months of supply, a buyer-friendly reading. Inventory is down 3.6% year over year to 180,607 homes for sale. None of that statewide softness is what changed the investor math this time. What changed is the price of insuring a Texas rental, and it changed unevenly across the state's four biggest cities.
Houston's insurance bill just rewrote the ranking
Houston's Gulf Coast hurricane exposure has always meant higher insurance than the rest of the state, but 2026's repricing widened the gap sharply. Multiple insurance-cost trackers now put Houston's average homeowners premium between roughly $6,400 and $9,100 a year depending on methodology and coverage assumptions, both well above the roughly $4,000 to $4,600 statewide Texas average. We modeled a representative $650-a-month landlord policy for Houston, the middle of that range, against Dallas at $350, Austin at $345, and San Antonio at $275, all inland or lower-risk markets facing comparatively modest premiums.
| Item | Monthly |
|---|---|
| Purchase price | $325,000 |
| Down payment (25%) / loan | $81,250 / $243,750 |
| P&I (6.66%, 30yr) | $1,566 |
| Property tax (2.03%, Harris County) | $550 |
| Insurance (hurricane-repriced, 2026) | $650 |
| PITI total | $2,766 |
| Gross rent (3BR SFR, Jul 2026) | $2,057 |
| DSCR (gross rent / PITI) | 0.74: FAILS |
| Vacancy (5%) / management (8%) | -$103 / -$165 |
| Maintenance reserve (1.5%/yr) | -$406 |
| Monthly cash flow | -$1,383 |
That $1,383 monthly loss makes Houston's net rental yield, rent minus every operating cost except the mortgage itself, just 0.68% of the purchase price a year. Gross yield still looks respectable at 7.6%, which is exactly the trap: gross yield ignores the insurance line entirely, and in Houston right now, that line is the whole story. Dallas lands at a nearly identical loss of -$1,387 a month through a completely different route, a lower insurance bill but a higher price, rent, and tax burden, converging on almost the same number from opposite directions.
So what for you: if you've been comparing Texas metros on gross yield or on a property tax rate alone, Houston is the clearest proof that insurance can flip a market's ranking entirely, and it's worth pricing an actual quote, not a statewide average, before you commit capital to any Gulf Coast-adjacent metro.
Get this in your inbox every Friday.
One email. The number that matters and what it means for you.
San Antonio is the new best of a bad set
San Antonio, at a flat-to-2025 $305,000 median (Bexar County), now holds the title Houston lost. At 25% down and 6.66%, its PITI runs $2,322 a month against a current 3-bedroom single-family rent of $1,813, a DSCR of 0.78. After a 5% vacancy allowance, 8% management fee, and 1.5%-of-price annual maintenance reserve, monthly cash flow lands at -$1,126, worse than our first-pass reading of -$885, but still the least-negative of Texas's four largest metros.
San Antonio's entry-level tier, centered on the housing market around Joint Base San Antonio, gets closer still. A representative $185,000 property in that submarket produces a DSCR of 1.05, which actually clears the 1.0 minimum most DSCR lenders require. Run the same property past vacancy, management, and a maintenance reserve, and it still loses about $359 a month. That's the same pattern we've now seen in Tennessee, Nebraska, and elsewhere this year: a DSCR pass tells you the loan qualifies, not that the property pays for itself, and San Antonio's military-adjacent entry tier is a clean example of the gap between the two.
So what for you: if you're set on a Texas cash-flow play, San Antonio's entry tier is the closest thing the state currently offers, but "closest to breakeven" and "breaks even" are different claims, and you should underwrite the full operating budget, not just the DSCR number, before you buy.
Dallas and Austin don't fare any better
Dallas, at a $383,000 median (Dallas County, down 1.7% year over year), carries a lighter insurance bill than Houston at roughly $350 a month, largely hail-driven rather than hurricane-driven, but a higher price, a 2.22% property tax rate, and a current 3-bedroom rent near $2,295 combine to produce a DSCR of 0.79 and a monthly cash flow of -$1,387, essentially matching Houston's number through a different cost structure entirely.
Austin remains Texas's worst market for cash flow, as it was in our first pass. At a $452,000 median, a 1.97% Travis County tax rate, $345-a-month insurance, and a current 3-bedroom rent of $2,400, its DSCR comes out to 0.73 and monthly cash flow to -$1,743, the largest loss of any Texas metro modeled here. Austin's rents remain well off their 2022 peak even as prices have held up better than the rent side of the ledger, a gap that continues to punish investor math specifically, separate from the state's insurance story.
So what for you: Texas's insurance story explains why Houston's ranking moved, but it doesn't rescue Dallas or Austin, and no major Texas metro clears positive cash flow at its current median under a full operating budget in 2026.
What Texas's real advantage still is, and isn't
None of this erases what makes Texas genuinely attractive to investors. Zero state income tax on rental income is real money that shows up on your tax return every year you hold the property, and it compounds over a long hold in a way a single month's cash flow doesn't capture. Texas also has no statewide rent control, meaning market rent is what you actually collect, and the state's 10% annual homestead assessment cap, while it does not apply in a property's first year of ownership, a common and costly assumption for buyers who model their tax bill off a seller's old assessment, does slow future tax growth on an investor's non-homestead property once that first-year reset has happened.
What Texas's reputation doesn't include, and should, is that the no-income-tax advantage shows up on your annual tax return, not in your monthly rent check. An investor comparing Texas to an income-tax state purely on that basis is comparing the wrong line item to the wrong problem. The math points toward treating Texas as an appreciation-and-tax-efficiency play for investors who already have cash-flow-positive property elsewhere, not as a market that pays for itself starting in month one, at least not at 2026's prices, rates, and insurance costs.
Frankly, if you've been drawn to Texas primarily for the no-income-tax headline, run the actual insurance quote for your specific metro and ZIP code before you commit capital, since the gap between Houston and San Antonio alone shows how much that single line item can move your answer. Before you underwrite any Texas deal, check it against a DSCR lender's real minimum, which typically runs higher than the bare 1.0 breakeven used here, and compare it to county-level yield data in neighboring markets, since our Dallas vs. San Antonio comparison found the same entry-tier-beats-metro pattern using 2026's earlier data. If the down payment itself is what's holding you back from a market you've already underwritten, the assumption that you need 20% down is often wrong and worth revisiting before you rule a deal out on cash requirements alone.