 Property
You're watching your rate lock at 3.8% while everyone around you talks about a market that's supposedly cooling. It's hard to know what that actually means for you until a number this size shows up: new single-family home sales fell 10.5% in July, to a seasonally adjusted annual rate of 607,000, according to the Census Bureau and HUD. That's the steepest one-month drop in new construction sales so far in 2026, and it landed the same week builders quietly raised the share of homes selling below list price. If you've been waiting for a signal that the balance of power is shifting toward buyers, this is a louder one than most of what has crossed your desk this year.
The headline number matters less than what's sitting behind it: a new-home supply glut that dwarfs anything happening in the resale market, and a price picture that is genuinely split down the middle depending on which end of the market you're looking at. Here's what moved, what it means, and why builder confidence rising anyway is the detail worth paying attention to.
Get this in your inbox every Friday.
One email. The number that matters and what it means for you.
New-home sales just posted their sharpest monthly drop of the year
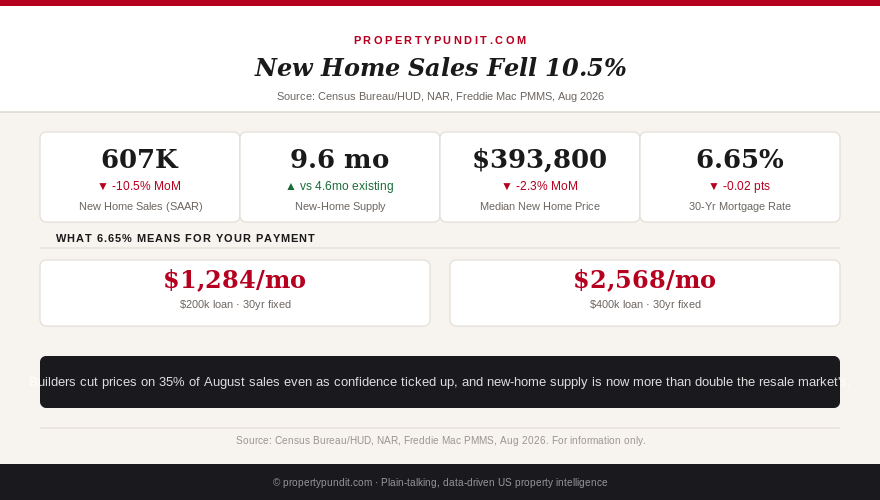
The Census Bureau and HUD's Monthly New Residential Sales report, released August 25, 2026, put July's new single-family home sales at a seasonally adjusted annual rate of 607,000. That's down 10.5% from June's revised 678,000 pace, and down 6.3% from the 648,000 rate a year earlier in July 2025. Every comparison in this report points the same direction: fewer new homes are selling than a month ago, and fewer than a year ago.
Context matters here. New-home sales are a small, volatile slice of total housing activity compared with existing-home sales, and a single month's drop can overstate the trend. But a 10.5% monthly decline is large enough to stand out even accounting for that volatility, and it followed a June reading that was itself unusually strong, which means the July pullback is partly a reversion rather than a fresh collapse. Either way, builders sold materially fewer homes in July than they had been.
So what this means for you: if you've been assuming new construction is the "easy" alternative to a competitive resale bidding war, July's numbers say the opposite. Builders are selling less, not more, which tells you they need buyers more than buyers need them right now.
9.6 months of supply is a number the resale market doesn't have to deal with
Months of supply measures how long it would take to sell every home currently listed at the current sales pace. Six months is the textbook line between a buyer's market and a seller's market. New-home supply hit 9.6 months in July, calculated from 488,000 homes for sale (up 1.9% from June's 479,000, though down 1.6% from a year earlier) against the slower sales rate. Compare that with the resale market: NAR's July existing-home report put months of supply at 4.6, unchanged from both June and a year ago. New construction is sitting in genuine buyer's-market territory while resale supply hasn't moved from balanced-to-tight in twelve months.
| Metric | New homes | Existing homes |
|---|---|---|
| Sales pace (SAAR) | 607,000 | 4,060,000 |
| Monthly change | -10.5% | -1.7% |
| Months of supply | 9.6 | 4.6 |
| Median price | $393,800 | $434,100 |
Builders are responding to that gap the way you'd expect. NAHB's August Housing Market Index survey found 35% of builders cut prices to support sales that month, down slightly from 37% in July, with an average price cut of 6%. That's the 16th straight month at least 30% of builders have reported cutting prices. If you're shopping new construction anywhere near a builder's active community, you have real room to negotiate on price, closing cost credits, or a rate buydown, and that negotiating room doesn't currently exist to the same degree on the resale side.
So what this means for you: a 9.6-month supply is a buyer's market by any standard definition, and it's happening in new construction specifically. If your search includes builder inventory, this is the moment to ask for a price cut or a buydown rather than accept list price.
The median price fell. The average price rose. Here's why that's not a contradiction
July's median new-home price was $393,800, down 2.3% from June's $403,100 and down 0.9% from a year earlier. In the same report, the average new-home price rose to $508,800, up 4.1% from June and up 5.4% year over year. Those two numbers moving in opposite directions in the same month reflect a market splitting into two, not a data error.
The median tracks the midpoint of all sales, so it moves with volume at the entry-level end, where builders are cutting price and offering incentives to keep sales going. The average is more sensitive to a smaller number of expensive closings pulling the top of the distribution up. Put those together and July looks like a market where builders are discounting the middle and lower end of their lineup to move inventory, while a thinner slice of higher-end, custom, and move-up product kept closing at strong prices, unaffected by the incentive war happening one price tier down.
So what this means for you: don't read a single new-home price headline as one market moving one direction. If you're shopping in the $350,000-$420,000 range, you're in the segment where builders are actively discounting. If you're shopping above $500,000, don't expect the same room to negotiate.
Builder confidence ticked up anyway, and that's the real signal
Builder confidence in the NAHB/Wells Fargo Housing Market Index rose one point to 35 in August, its second straight monthly gain, but it's still the 16th consecutive month below the neutral 40 mark. The details inside the index explain the disconnect with July's weak sales report: current sales conditions improved two points to 39, sales expectations over the next six months held steady at 43, and prospective buyer traffic stayed flat at 23. Builders are marginally more confident about where things are heading than about where they are today, which is a forward-looking bet on rates, not a read on July's actual results.
That bet lines up with what happened to mortgage rates the same week. Freddie Mac's Primary Mortgage Market Survey put the 30-year fixed at 6.65% for the week of August 20, 2026, down from 6.67% the week before, the second straight weekly decline. On a $200,000 loan that's a principal-and-interest payment near $1,284 a month; on $400,000 it's about $2,568. Two weeks of easing is real, but it isn't a trend yet, and builder confidence sitting 5 points below neutral after a decade-plus of elevated rates tells you the industry isn't betting on a fast reversal either.
So what this means for you: the math points toward treating this as a buyer's window in new construction specifically, not a signal to wait for rates to drop further before acting. Builders who are cutting prices and offering buydowns today are making that bet regardless of what the Fed does next, and that incentive can shrink the moment rates actually fall and their own sales pick back up.
What to actually do with this data
If you're house-hunting right now, the practical read is this: new construction is the segment carrying the most negotiating power a buyer can use this month, concentrated in the entry-to-mid tier where builders are cutting price on more than a third of sales. Frankly, if you're pre-approved and shopping in that $350,000-$420,000 band, most people who run these numbers end up asking for a rate buydown or a closing-cost credit rather than a straight price cut, since builders often have more room to move there without touching their advertised price. Before you sign anything, make sure you understand what's actually driving your rate offer, what a realistic down payment looks like against a builder incentive package, and what's actually included in the closing costs a builder is offering to cover versus what you'll still pay yourself. A buydown that saves you $200 a month is only a good deal once you've confirmed the base price wasn't marked up to fund it.