 Property
If you ran the numbers on a Warwick rental using this site's June spotlight, your cash flow projection was too optimistic, and the gap isn't small. We reported Warwick's residential property tax rate as $12.70 per $1,000 of assessed value. Rechecking it this week against the city's current rate table, the actual figure is $19.26 per $1,000, and Warwick has no homestead exemption to soften that for an owner-occupant, let alone a landlord. That's 52% higher than what you would have plugged into your underwriting two months ago. If you're mid-negotiation on a Warwick property, or you closed on one since June using our old number, it's worth pulling out your calculator before you go any further.
We're not burying this correction. A subscriber underwriting the state's rental math deserves the real number, not the flattering one, and this is exactly the kind of second-pass check every state on this site gets roughly every two months: prices, rents, tax rates, and any new legislation get re-verified from scratch rather than carried forward on trust. This time the correction runs deeper than one city. Providence's blistering appreciation from earlier this year has slowed hard, and a new statewide tax that's been generating headlines turns out to be nearly irrelevant to the properties investors are actually buying.
Providence's cooling curve: 23% appreciation to 5% in five months
Providence's median sale price was $645,000 in our March data pull, up a startling 23.2% year over year. Redfin's most recent three-month window, ending June 2026, puts the city's median at $574,687, still up year over year but by just 5.1%, a fraction of the earlier pace (Redfin, June 2026). Some of that gap is a difference in the exact window measured, not a single dramatic price crash, but the deceleration itself is real and consistent with what's happening across the broader Providence-Warwick market: homes sell in 28 days on average now, up from 17 days a year ago, and price cuts are creeping in on 18.9% of listings, up 2 points year over year. The frantic, 23%-a-year Providence of early 2026 was not a stable baseline to underwrite against, and this pass confirms it wasn't one.
The lower price point actually helps the cash flow math, even after everything else in this update moved the wrong way. At $574,687 and 6.65%, 25% down, a Providence rental's principal-and-interest payment runs about $2,767 a month, versus roughly $3,054 a month at the old $645,000 figure. That's the one piece of good news in this update: if you're pricing a Providence property today rather than chasing the number from five months ago, your entry cost is meaningfully lower than what this site was showing investors in the spring.
The three markets, recalculated
Running full PITI plus vacancy and management costs on all three of Rhode Island's largest rental markets, at 6.65% and 25% down, none of them clear positive cash flow, and none of them come close to the roughly 1.0 debt service coverage ratio most DSCR lenders require:
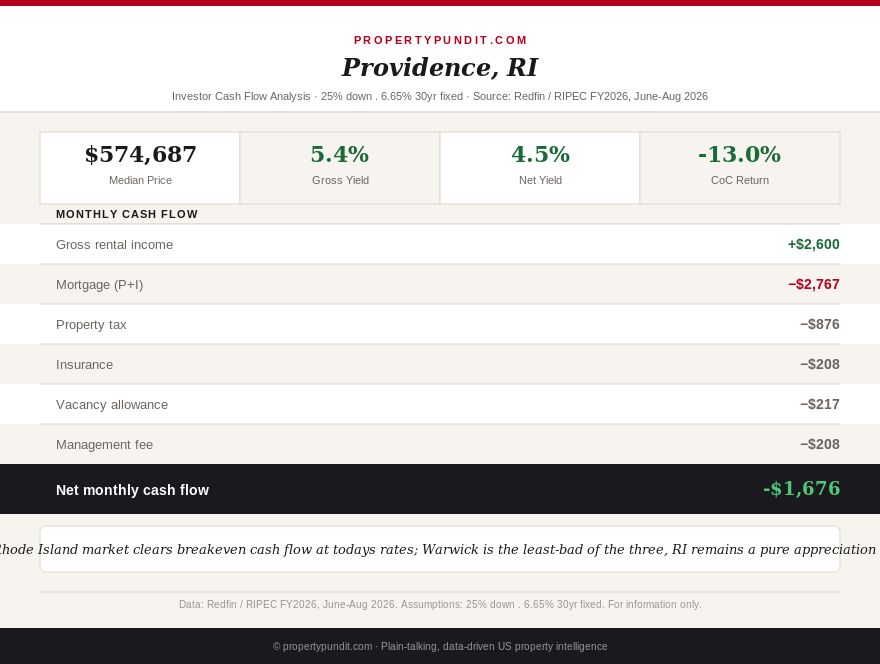
Providence: median price $574,687 (Redfin, June 2026), non-owner-occupied effective tax rate 1.83% (Providence taxes non-owner-occupied residential as commercial, 3.5 times the owner-occupied rate, per the Rhode Island Public Expenditure Council's FY2026 report). PITI runs about $3,852 a month against a typical $2,600 gross rent for a 3-bedroom house. After vacancy and management, net cash flow lands at roughly negative $1,676 a month, DSCR 0.56.
Warwick: median price $449,755, up 6.6% year over year (Redfin, June 2026), the fastest-growing of the three cities. Corrected tax rate $19.26 per $1,000 assessed (1.926%), no homestead exemption. PITI runs about $3,096 a month against a typical $2,300 gross rent. Net cash flow lands at roughly negative $1,171 a month, DSCR 0.62, the least-bad of the three markets but still well short of breakeven.
Pawtucket: median price $414,752 in Redfin's most recent reading, though this is a genuine source discrepancy worth naming rather than smoothing over. Our June figure for Pawtucket was $340,000, and Redfin's own metro-level tracking shows Pawtucket prices down 3.5% year over year over the same recent window. The jump most likely reflects a shift in which homes sold, a heavier mix of larger single-family transactions rather than the entry-level multi-family stock that anchored the June figure, not a genuine two-month, 22% run-up. Using a landlord-facing tax rate of $24.50 per $1,000 (Pawtucket runs a homestead exemption that reduces taxable value for owner-occupants only), PITI runs about $3,052 a month against a typical $2,050 gross rent. Net cash flow lands at roughly negative $1,337 a month, DSCR 0.56.
So what this means for you: if you already own in Warwick, you're sitting in the best-performing of the three markets on a relative basis, but "best" here still means losing over $1,100 a month before any appreciation shows up on paper. There's no version of this math where a 25%-down, market-rate purchase in Rhode Island's three biggest rental cities cash flows today.
The 'Taylor Swift Tax' everyone's talking about, and why it probably doesn't touch you
Rhode Island's new Non-Owner-Occupied Property Tax took effect July 1, 2026, and it's been nicknamed the "Taylor Swift Tax" in local coverage, a nod to out-of-state owners of high-value coastal second homes. The mechanics: $2.50 for every $500 of assessed value above $1 million on a residential property not occupied by the owner at least 183 days a year, paid in four installments through the year. It's projected to raise about $25 million annually from an estimated 9,000 to 10,000 properties statewide (RI Division of Taxation; Pierce Atwood legal alert, 2026). Long-term rentals under a lease of 183 days or more are exempt outright.
None of that touches a $449,755 Warwick rental or a $574,687 Providence one. The threshold sits well above every price point in this article, and even the exemption clause is beside the point since these properties don't cross $1 million assessed value to begin with. The real, ongoing tax burden on a typical Rhode Island rental isn't the headline-grabbing mansion tax; it's the everyday non-homestead classification that's been quietly running 1.8 to 3.5 times the owner-occupied rate for years, the gap RIPEC's FY2026 report flags as one of the widest in the country. If a Rhode Island listing agent brings up the Taylor Swift Tax as a reason to worry, or as a reason a deal looks cheap, that's a signal they haven't actually run your specific property's numbers.
Get this in your inbox every Friday.
One email. The number that matters and what it means for you.
Where the numbers point for Rhode Island investors
The math here points toward treating Rhode Island as a pure appreciation thesis, not a cash-flow one, and being honest with yourself about the fact that Providence's appreciation just quartered in five months. A $1,676 monthly loss on a Providence rental needs years of price gains just to break even against the carrying cost, and 5.1% is a much thinner cushion to bank on than 23.2% was. Most people who run this math end up either passing on Rhode Island entirely in favor of a market with a positive or near-positive DSCR, such as the higher-yield counties this site has mapped in other states, or going in with a longer hold horizon and a much larger cash cushion than a 25%-down purchase assumes, specifically because none of these three markets qualify for a standard DSCR loan at anything near the current median.
If you're weighing a Rhode Island purchase against financing options more broadly, it's also worth remembering that the 20%-down assumption many investors default to isn't the only path in; it's simply the convention this site uses for apples-to-apples comparisons across states. Whatever the entry structure, the underlying rent-to-cost gap here is large enough that no reasonable down payment or financing tweak closes it on its own. Warwick, corrected numbers and all, remains the closest of the three to viable, and that's worth knowing before you write an offer anywhere else in the state.