 Property
You check your rate-tracking app before you check the weather. Nine months into a search you can't quite afford at $112,000 a year, you've learned to read every headline for a sign that waiting is finally paying off. This week gave you one: the market's own temperature gauge just posted its seventh straight weekly drop. Before you take that as your green light, run the numbers that actually decide your monthly payment, because they didn't fall with it.
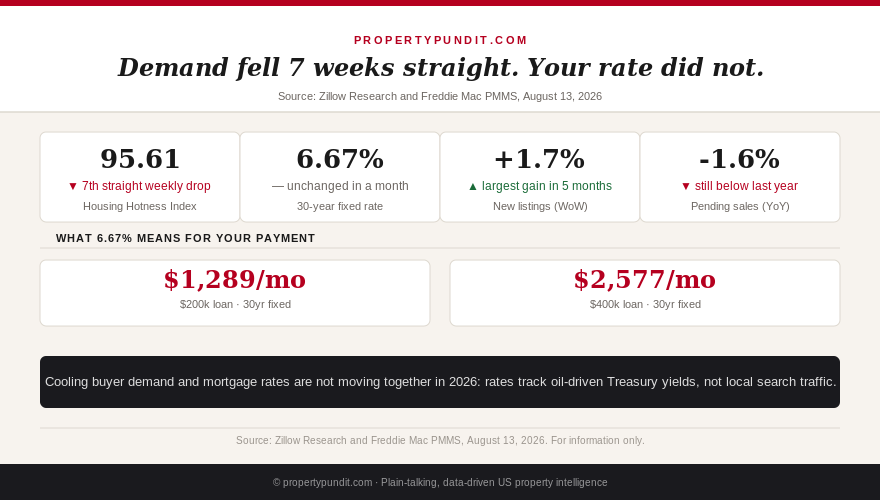
Zillow's US Housing Market Hotness Index slipped to 95.61 for the week ending August 9, 2026, down from 95.94 the week before, its seventh consecutive weekly decline (Zillow Research, released August 13, 2026). Zillow's own chief economist, Mischa Fisher, put it plainly: July "may represent the peak of what we can expect for the rest of the year." That reads like the market finally handing buyers some room to negotiate. Freddie Mac's 30-year fixed rate tells a different story: it held at 6.67% the same week (PMMS, August 13, 2026), essentially unchanged from a month earlier. Two numbers that are supposed to move together didn't.
Get this in your inbox every Friday.
One email. The number that matters and what it means for you.
Demand fell for 7 weeks. Rates didn't follow it down
The hotness index measures something real: how many people are searching, saving, and touring homes in your metro, and how fast those homes go pending. A falling index means fewer people bidding against you this week than in June. It doesn't measure the 10-year Treasury yield, and that's the number your rate actually tracks. Every material rate move in 2026 has been geopolitical, driven by oil-price swings tied to the on-again, off-again US-Iran conflict, not a shift in how many buyers are touring open houses (Treasury and PMMS data, 2026). The 30-year fixed started the year near 5.99% in late February, climbed to 6.75% by May 21, cooled into the low 6.40s in June, then spent July and August grinding back up toward 6.7%-6.8% as the conflict flared and cooled again.
The Fed hasn't moved either. It has held its target range at 3.50%-3.75% for five consecutive meetings through July 29, and three regional presidents actually dissented in favor of a hike, not a cut, at that meeting. The next opportunity for a policy move is September 15-16. So what that means for you: a plan built around "wait until the market cools enough that rates follow" is waiting on a lever that hasn't moved in your favor once this year, and the group that sets it is currently leaning the opposite direction.
What a 7th straight weekly decline in demand has actually bought buyers
The real negotiating room from a cooling market is showing up somewhere else: on individual listings, not in your financing cost. New listings rose 1.7% week over week for the period ending August 9, the largest weekly gain in five months (Redfin, August 13, 2026). Pending sales fell 7.7% month over month in July to a five-month low (Redfin, reported August 7, 2026), and the four-week measure through August 9 is still running 1.6% below a year ago, even with that tiny weekly rate improvement. Sellers are seeing fewer offers per listing than they were in spring, and it's showing up as record concessions, not as a friendlier PMMS print.
So what that means for you: the seventh straight week of falling demand is real negotiating room, but it lives in the specific house you're bidding on, not in a rate you're hoping to lock later. A listing that's been sitting through this entire cooling stretch is a seller who has already watched the buyer pool shrink without a serious offer, and that's where this week's data actually helps you.
The math: a price cut beats waiting for a friendlier rate
Take a $350,000 target home, roughly in range for a $112,000 income at 10% down under the standard 28% front-end rule. At 6.67%, the $315,000 loan carries about $2,027 a month in principal and interest. Now compare two ways that number could improve.
| Scenario | What changes | Monthly saving |
|---|---|---|
| Rate improves to 6.52% | 15 basis points, a realistic weekly wiggle | about $31/month |
| Rate improves to 6.2% | requires spread compression back to a typical 1.7 points over the 10-year Treasury, not guaranteed | about $97/month |
| $10,000 price cut, same rate | negotiated off a listing that's been sitting | about $58/month, plus $10,000 less debt permanently |
A realistic rate wiggle of 15 basis points is worth about $31 a month, roughly a third of what a $10,000 price cut delivers, and the price cut also reduces the amount you'll owe for the life of the loan. Getting to the bigger 6.2% scenario would require the mortgage-Treasury spread to compress from today's roughly 2.0 points back to its more typical 1.7, something no cooling-demand headline can promise you (FRED 10-year Treasury and Freddie Mac PMMS, August 2026). Before you run this comparison on your own target price, make sure you understand what you're actually financing; our breakdown of what closing costs actually cover is worth reading first, and if the down payment feels like the bigger obstacle than the rate, the down payment myth explains why 20% isn't a requirement for most loan types. So what that means for you: the lever that's actually available this week is the price on a specific listing, not a rate move nobody can schedule for you.
So when does "cooling" actually turn into a lower rate?
It can, eventually, but not through the channel most buyers assume. Mortgage rates track the 10-year Treasury yield plus a spread that's been running wider than normal, roughly 2.0 points versus a more typical 1.7. That spread narrows when bond investors get comfortable taking on more risk broadly, which is a function of the wider economy and geopolitical calm, not how many people toured homes in your zip code last week. A softening labor market, like the 57,000 jobs added in June against a 4.2% unemployment rate, does eventually pressure the Fed toward cuts, but that's a 2027 conversation under the Fed's own current guidance, not something this week's demand index is going to accelerate.
One thing that will move your personal rate faster than any national headline: your own credit profile. If a low credit score, not the market, has been holding your quoted rate up, our piece on the credit score mortgage myth walks through how much a modest score improvement can shave off your quote, often more than a full week of PMMS movement. So what that means for you: don't wait on a macro trigger you can't control when a controllable one might move your number faster.
What this means for your search this week
The math points toward acting on the specific listings in front of you, not toward waiting for a market-wide signal that arrives on its own schedule. Seven straight weeks of falling demand is genuine news, but it's showing up as sitting inventory and softer competition, the kind of bargaining power you use on a negotiation, not as a rate cut you can bank on. Frankly, if you've been treating the hotness index as a rate forecast, this week's PMMS reading is your answer: the two have been decoupled for months, and there's no evidence that's about to change before your next open house.
Most people who run this comparison honestly end up concluding the same thing: a stale listing with a motivated seller is worth more to your monthly payment right now than a rate you're hoping shows up later. Screen your shortlist for days-on-market and lean into the ones that have been sitting through this cooling stretch. Then run the actual numbers on the specific house, not the national average, with our mortgage calculator, so you know exactly what a real offer would cost you before you make one.