 Property
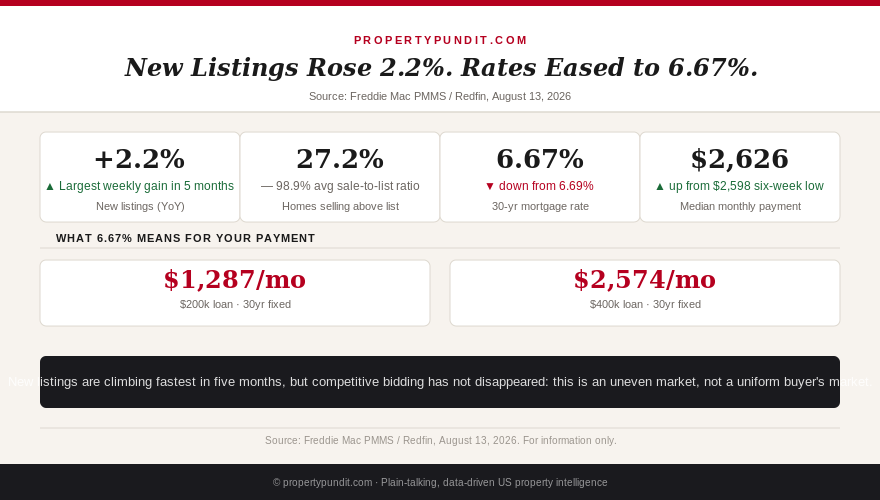
Your rate-tracking app probably flagged this Thursday: mortgage rates eased to 6.67%, down from 6.69% the week before (Freddie Mac PMMS, August 13, 2026). Do the math before you get excited, because a 2 basis point move saves about $5 a month on a typical loan. The number that should actually change your weekend plans is a different one. New listings rose 2.2% year over year for the four weeks ending August 9, the strongest weekly gain in five months (Redfin, August 13, 2026). More houses are showing up in search results this week than at any point since March.
Here's the number that keeps this from feeling like straightforward relief: 27.2% of homes that sold this period went for more than the asking price, and the average sale-to-list ratio nationally held at 98.9% (Redfin, week ending August 9, 2026). More listings and tight competition are both true at once, in different corners of the same market. Which corner you're shopping in decides whether this week is your opening or just more noise.
Get this in your inbox every Friday.
One email. The number that matters and what it means for you.
The listings surge is real, but it isn't spread evenly
New listings climbed 1.7% week over week and 2.2% year over year for the four weeks ending August 9, the largest weekly gain in five months (Redfin, August 13, 2026). That lifted total active listings up 0.7% week over week too. But national supply still sits around 3.7 months, well short of the 6-month mark that textbook definitions use for a true buyer's market, and pending sales rose just 0.4% week over week after touching a five-month low, still down 1.6% year over year. Translation: the extra inventory hasn't turned into a wave of extra buyer power yet. It's simply more product on the shelf, not more discounting behind it.
That distinction matters for how you spend your Saturday. If your target metro posted one of this period's bigger new-listing gains, you genuinely have more houses to compare against each other than you did in July. So what that means for you: widen your shortlist this week instead of anchoring on the first listing that fit your budget, because the odds you'll find a better-priced comparable just improved for the first time since spring.
27% still sell above list. That's not what a buyer's market looks like everywhere
National headlines have called this a buyer's market for weeks, largely based on Redfin's broader buyer-to-seller ratio (47% more sellers than buyers as of the last full read). But 27.2% of homes sold above asking for the week ending August 9, and the average sale-to-list ratio was 98.9%, meaning the typical home is still closing within a penny of full price. Months of supply and sale-to-list ratio are two different measurements, and national inventory sitting in balanced territory doesn't stop a well-priced, well-located listing from drawing three offers the same week a similar house two towns over sits for 60 days.
So what that means for you: don't walk into every showing assuming you're the one with the power. Pull the specific sale-to-list ratio and days-on-market figure for your target zip code before you decide how aggressively to negotiate; the national split tells you competition is uneven, not that it's gone.
| Metric | This week | Signal |
|---|---|---|
| New listings (YoY) | +2.2% | More choices |
| Pending sales (YoY) | -1.6% | Demand still soft |
| Months of supply | 3.7 | Below buyer's-market threshold |
| Homes selling above list | 27.2% | Uneven competition remains |
Rates barely moved. Do the math before you celebrate it
Take Redfin's own reported median sale price of $403,706 for the week ending August 9, 2026. With 10% down, the loan amount is $363,335. At 6.67%, principal and interest run about $2,337 a month. At last week's 6.69%, the same loan runs about $2,342. That's a $5 monthly difference for a rate move the headlines treated like news.
| Rate | Loan amount | Principal + interest |
|---|---|---|
| 6.69% (Aug 6, 2026) | $363,335 | $2,342/mo |
| 6.67% (Aug 13, 2026) | $363,335 | $2,337/mo |
The conclusion doesn't change if you're putting down more. At 20% down on that same $403,706 median, the loan shrinks to $322,965, and the gap between 6.67% and 6.69% is about $4 a month, roughly $2,082 versus $2,078. A bigger down payment lowers your total payment, but it doesn't make a two-basis-point rate move worth more; the dollar impact of a small rate change scales with the loan, and this week's move is small either way.
Meanwhile Redfin's own median monthly housing payment actually rose to $2,626 for that same period, up from the $2,598 six-week low reported in early August, because the payment figure tracks the mix and price of homes actually closing, not just the week's rate. A rate headline and your real payment can move in opposite directions in the same week. So what that means for you: stop treating a single-digit rate move as a reason to wait. The number that changes your monthly payment meaningfully is the price you negotiate on the specific house, not the weekly PMMS print.
Before you run these numbers on your own target price, get the full closing picture straight; our breakdown of what closing costs actually cover is worth reading first, and if a 20% down payment feels like the real obstacle, the down payment myth explains why that threshold isn't a requirement for most loan types.
What this means for your shortlist this week
The math points toward acting on individual listings, not waiting for the market to change uniformly. New listings are climbing fastest in five months, which means your odds of finding a better-priced comparable just improved. But 27.2% of homes are still selling above list, which means treating every listing as a lowball opportunity is the wrong read on the same data. Screen for days-on-market on your shortlist; a home that's been listed 30 days or longer in a metro where new listings are climbing is a seller who's already watched the buyer pool widen without a bite, and that's where negotiating room actually exists.
Frankly, if you've been holding out for a materially better rate before you write an offer, this week's PMMS reading is your answer: 2 basis points and $5 a month is what "waiting for rates to move" is currently buying you. Most people who run this comparison honestly end up concluding the price on a sitting listing is the lever worth pulling, not the rate. If your credit score has been the thing holding your pre-approval back rather than the rate itself, our piece on the credit score mortgage myth is worth a read before your next application, since a small score improvement can move your quoted rate more than a full week of PMMS headlines.
None of this means you should offer on the first thing you see just because it's been sitting. A stale listing can be stale for a reason your inspector will find, so pair the days-on-market screen with an honest look at the listing photos and price history before you get attached. The point isn't to rush; it's to stop waiting on a variable, the weekly rate print, that has moved a total of two basis points while the more useful variable, seller motivation on specific homes, has been shifting under your feet all month.
Then run your own shortlist through the numbers rather than trusting a national average. Our mortgage calculator takes the actual asking price, your down payment, and today's rate and tells you the real monthly number, which is the only one that decides whether a specific house works for your budget.