 Property
You have been watching your rate for over a year now. You bought at 3.8% back before any of this started, and every week you run the same mental math: is it finally worth it to touch that rate. This week's answer, according to the Mortgage Bankers Association's latest survey, is that a lot of your neighbors just decided yes, even though almost none of them have your rate. Applications jumped 3.6% for the week ending August 7, 2026, and refinance applications specifically rose 5%. But look one line down in the same report and the picture flips: refinance volume is still 22% lower than the same week a year ago. Both numbers are true at once, and the gap between them is the actual story.
What the MBA's latest numbers actually show
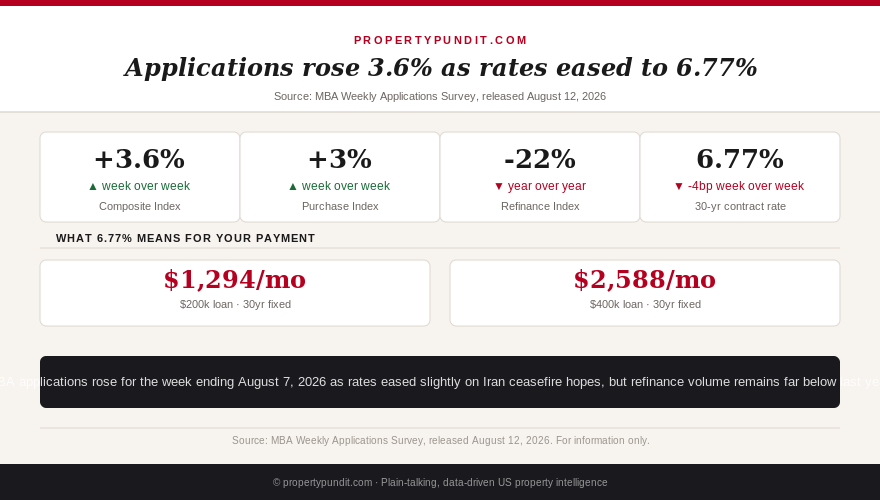
The Market Composite Index, the MBA's broadest measure of mortgage demand, rose 3.6% on a seasonally adjusted basis for the week ending August 7, 2026. The Purchase Index climbed 3%, and the Refinance Index rose 5% week over week. The average contract rate on a 30-year conforming loan fell 4 basis points to 6.77%, still close to its highest level in a year. MBA's Joel Kan tied the move directly to a brief dip in oil prices tied to hopes for a sustained resolution to the war in Iran: "After five consecutive weeks of increases, mortgage rates declined slightly last week." FHA, VA, and USDA loans all held steady as a share of total applications, meaning the mix of buyers didn't shift, just the volume.
Kan's report also flagged something easy to miss in the headline number: "as refinance incentives have dwindled with rates at current levels, the average loan size for refinance applications was down to its lowest level since July 2025." That's the tell. More people applied to refinance this week, but the typical refinance is now a smaller loan than it has been in over a year, which points toward smaller balances, FHA and VA streamline refinances, and cash-out borrowers solving a specific problem, not a broad wave of homeowners chasing a meaningfully lower rate. If you're sitting on a rate in the 3s or low 4s, this week's 3.6% headline wasn't about you, and it wasn't supposed to be.
Get this in your inbox every Friday.
One email. The number that matters and what it means for you.
Why rates eased even as the "highest in a year" headline stuck around
Freddie Mac's official PMMS reading, the benchmark this site uses for the headline rate, still shows 6.69% as of August 6, 2026, the fourth straight weekly increase and the highest weekly average in over a year. Today's PMMS release, due at noon ET, had not published as of this writing, so treat that 6.69% figure as the last confirmed official number. Daily trackers are already pointing lower: Fortune's Mortgage Research Center partnership showed the 30-year conventional average at 6.698% on the morning of August 13, down from 6.731% the day before, with FHA and VA quotes easing 3 basis points too. The move lines up with the same driver behind this week's MBA report: a brief pullback in oil prices as traders priced in hope for a more durable Iran ceasefire, not a shift in Federal Reserve policy.
That distinction matters more than the 4-basis-point move itself. The Fed held its target range at 3.50%-3.75% for a fifth consecutive time on July 29, with three regional presidents dissenting in favor of a hike, not a cut. Futures markets are now pricing in the possibility of two more hikes before year-end rather than any cuts. The next FOMC meeting is September 15-16. So this week's easier rate is a geopolitical exhale, not the start of a trend, and it has already reversed on you before: rates eased in mid-July on ceasefire hopes, then spiked right back when the ceasefire collapsed days later. Don't confuse a good week with a good year.
Zoom out to the full year and the pattern gets clearer still. The 30-year fixed started 2026 near 5.99%, climbed to 6.75% by late May, briefly cooled to the low 6.4s in June, then spent July and August grinding back up toward 6.7% as the Iran conflict reignited. Every dip so far has been geopolitical, and every spike has been geopolitical too. None of it has come from the Fed easing or tightening policy, which is exactly why this week's applications bump reads more like noise around a stable, elevated rate than the start of a genuine thaw. Treat any single week's PMMS or MBA print the same way you would a single day's stock price: informative, but not a trend on its own.
The refi math still does not work for most 2020-2021 borrowers
Here is the arithmetic that explains why applications can rise 5% in a week while total refinance volume stays 22% below last year. Take a homeowner who bought in late 2023 at 7.5%, closer to today's environment than most current articles assume, on a $380,000 loan. At 7.5%, principal and interest runs about $2,657 a month. Refinancing into today's roughly 6.77% rate drops that to about $2,470, a savings of $187 a month. Typical refinance closing costs run 2% to 4% of the loan amount; call it $9,500 for a loan this size (see our closing costs explained breakdown for the full fee list). Divide $9,500 by $187 and the break-even point lands past 50 months, over four years, before the refinance actually saves money.
Now run the same math for someone who bought at 4.5% in 2021. There's no version of today's 6.77% that produces a monthly savings at all; the payment goes up, not down, and no rational borrower does that voluntarily. That's the entire refinance market in one sentence: only the borrowers who bought highest, generally in 2023 and 2024, have a mathematical case for refinancing today, and even they need to plan on staying put for four-plus years to come out ahead once closing costs are counted. Lenders will also re-underwrite your credit file before closing, so a clean file matters as much as the rate itself; see our piece on what actually moves your credit score before closing if you're within a few points of the next pricing tier.
What this means for the next few weeks
Today's official PMMS print, due at noon ET, will be the first hard confirmation of whether this week's daily-tracker dip holds or reverses, the same pattern the MBA-versus-PMMS divergence has followed most weeks since early July. The next scheduled catalyst after that is the September 15-16 FOMC meeting, and with the Fed's own dot plot removed of any easing bias since June, there's no policy-driven rate relief on the calendar between now and then. Anything that moves rates in the next five weeks is more likely to come from the Iran conflict, an inflation surprise, or a soft jobs print than from the Fed itself.
The math points toward a simple rule for anyone tracking their own refinance trigger: if your current rate is above roughly 7.2%, run your specific break-even number today, because rate dips this year have proven short-lived and the closing-cost math only clears with several years of holding the loan. If your rate starts with a 3, 4, or low 5, this week's applications data was not built for you, and the smarter move is to keep tracking the weekly PMMS print rather than reacting to a single week of MBA headlines. Most homeowners who run these numbers end up concluding the same thing: the rate you already have is still the best rate you're going to see this year.
If you're shopping for a purchase loan rather than a refinance, the same 3.6% applications bump is a small, genuine signal worth watching over the next few weeks, since a sustained pickup in the Purchase Index alongside a softer rate would be the first real sign of demand returning after a slow summer. One soft week isn't that signal yet. Keep an eye on next Thursday's PMMS reading and the following week's MBA report before reading anything more into today's numbers than a brief reprieve.