 Property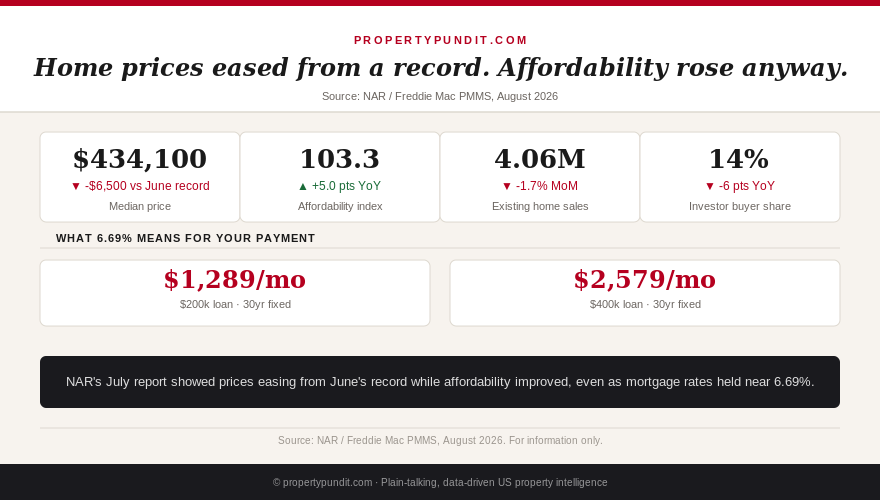
The median price of an existing home in the United States fell to $434,100 in July, down $6,500 from June's record $440,600, according to the National Association of Realtors' report released August 11. If you've spent the summer checking a rate tracker every Monday morning, waiting for a signal that the math is finally bending your way, this is that signal, even if it's a small one.
It arrived next to a second, more surprising number. NAR's Housing Affordability Index registered 103.3 in July, up from 98.3 a year earlier, meaning the typical household now earns slightly more than what's needed to qualify for a median-priced home under standard underwriting. That's the first time this index has cleared 100 in months, and it happened while the 30-year fixed rate sat at 6.69%, the highest weekly average in over a year (Freddie Mac PMMS, August 6, 2026). Higher rates were supposed to make affordability worse, not better.
Sales slipped too: existing-home sales fell 1.7% month over month to a seasonally adjusted annual rate of 4.06 million, though that's still up 0.7% from a year ago. Inventory dropped 1.9% month over month to 1.54 million units, holding months of supply flat at 4.6. None of these numbers, taken alone, tells you much. Put together, they describe a market where price growth is finally losing momentum without falling apart, which changes the calculation for anyone deciding whether to buy now or wait.
Get this in your inbox every Friday.
One email. The number that matters and what it means for you.
Why affordability improved while rates stayed near an 11-month high
The affordability index compares the median household's income against the income needed to cover principal, interest, taxes and insurance on the median-priced home, assuming a standard down payment. Two things moved it this year: prices cooled from their spring peak, and incomes kept growing at a steadier pace than home values did. NAR's own numbers back this up region by region. Year-over-year affordability improved everywhere: the Northeast gained 1.5%, the Midwest 4.0%, the South 6.1%, and the West, the least affordable region in the country, actually improved the most at 7.3%.
NAR chief economist Lawrence Yun pointed to a detail that matters if you live somewhere other than a coastal metro: in smaller cities, particularly in the Midwest, an annual household income of $60,000 is now enough to buy a median-priced home. That's a very different reality than the one facing a buyer in San Francisco or Boston, where the price-to-income gap remains extreme. An affordability index of 103.3 is a national average sitting on top of huge local variation, so before you read too much into the headline number, check whether your metro is one of the ones actually improving or one dragging the average down while your own market keeps getting harder.
The math: what $6,500 off the median actually saves you
Here's what that price move is worth in dollars, isolated from everything else. A buyer putting 10% down on June's record median of $440,600 would finance $396,540. At today's 6.69% rate over 30 years, that's a principal-and-interest payment of about $2,556 a month. Finance the same 10% down on July's $434,100 median instead, and the loan shrinks to $390,690, dropping principal and interest to roughly $2,518 a month, a savings of $38.
Add typical property tax and insurance (roughly $369 and $255 a month at national averages) and the full monthly payment moves from about $3,180 to $3,142. Thirty-eight dollars a month won't change anyone's decision on its own. But it's real money that didn't exist a month ago, it came without you doing anything, and it's the first month in a while where the price line moved in a buyer's favor instead of a seller's. If you're negotiating on a specific home right now, that same logic applies at a bigger scale: a seller willing to come down $10,000-$15,000 from list, which is increasingly common with inventory holding steady, is worth more to your monthly payment than waiting for a quarter-point rate cut that keeps not showing up. Understanding how much of your monthly number is math you can negotiate, like price, versus math you can't, like the closing costs due at signing, is the difference between negotiating effectively and just hoping.
Investors just made their biggest retreat of the cycle
Individual investors and second-home buyers accounted for just 14% of July transactions, down from 20% a year ago and down from 13% in June. That's a meaningful shift: a year ago, roughly one in five sales went to an investor or a second-home buyer; now it's closer to one in seven. Cash sales, often a proxy for investor activity, ran 26% of transactions, up slightly from 25% in June but still well below 31% a year ago. Distressed sales (foreclosures and short sales) held flat at just 2%, so this isn't forced selling into a soft market; it's investors choosing not to compete.
The reason shows up every week in this site's state-by-state investor math: at a 6.69% rate and today's prices, the vast majority of major metros no longer produce positive cash flow on a standard rental purchase, even in states with low property taxes or no income tax. When the numbers stop working for professional investors, they simply stop buying, and that pullback is good news if you're a first-time buyer who has been losing bidding wars to all-cash offers. One in five competing buyers a year ago disappearing to one in seven is a real reduction in competition at the exact price points most first-time buyers are shopping.
First-time buyers pulled back too, but don't read too much into one month
First-time buyers made up 29% of July sales, down from 33% in June but still above 28% a year ago. Median days on market ticked up to 29, from 28 both last month and a year ago. Taken alone, a first-time buyer share falling month over month could look alarming. In context, June's 33% was itself an unusually strong reading, and July's 29% is still ahead of where the market stood twelve months ago. Summer sales data moves around for seasonal reasons that have nothing to do with underlying demand, which is exactly why economists prefer year-over-year comparisons over month-to-month ones for a market this size.
What hasn't changed is the more persistent story behind the headline: buyers with a shaky credit profile or a thin down payment are still the ones most exposed when rates sit above 6.5%, because the rate you're actually quoted can run well above the average once your score and loan-to-value ratio are factored in. If your first-time buyer share of the market keeps recovering even slightly on a year-over-year basis while investors keep retreating, that combination is worth watching over the next couple of reports, not dismissing after one month.
What this actually means if you're sitting on a low rate and watching from the sidelines
If you already own a home at 2026's version of a good rate, nothing in this report changes your refinance math. Rates are still near an 11-month high, and no one refinances out of a 3-4% loan into 6.69% voluntarily. What this report does change is how you should read the market you'd be re-entering if you sold and bought again, or if you're deciding when to make a move-up purchase. Prices are cooling from a record, affordability is improving for the first time in months, and your competition, particularly all-cash investor competition, is thinning out. That's a friendlier environment to sell into and buy into than the one that existed all spring.
For a buyer still on the sidelines waiting for the market to get easier before committing, the math points toward acting on the current data rather than betting on a future rate cut that has been delayed all year. Frankly, if you've been waiting for a signal that the numbers are turning, three of them just did in the same report: price down, affordability up, investor competition down. Most people who run these numbers side by side end up concluding that getting pre-approved now and negotiating hard on price, rather than waiting on the Fed, is the higher-odds play. None of that requires abandoning a sensible down payment strategy either; if you've been told you need 20% down to buy responsibly, it's worth checking that assumption against how the 20% down payment myth actually holds up, and whether PMI on a smaller down payment is really the deal-breaker it's made out to be.