 Property
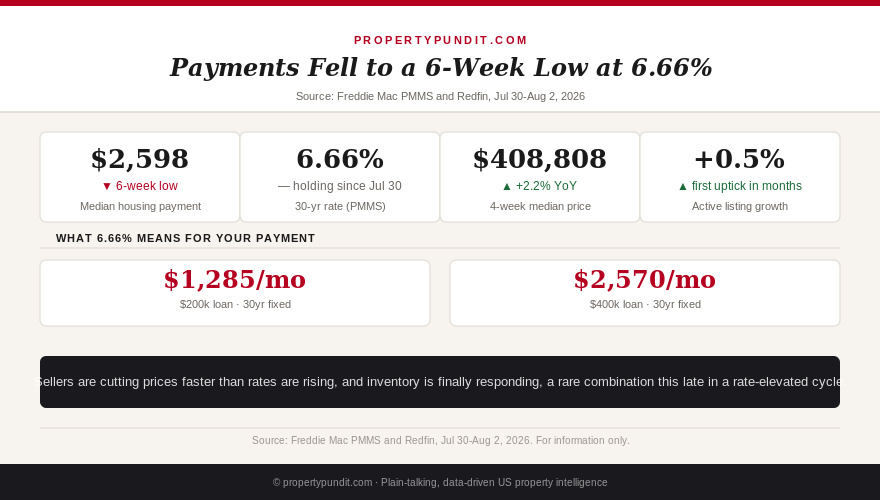
The national median monthly housing payment fell to $2,598 during the week ending August 2, its lowest level in six weeks, even though the average 30-year mortgage rate sat within a hair of its highest point in a year (Redfin, August 2, 2026). If you have been holding off on a purchase because 6.66% feels too expensive to commit to, that gap between a rising headline rate and a falling actual bill is the number that should change your math this week.
Freddie Mac's Primary Mortgage Market Survey still shows the 30-year fixed rate at 6.66%, unchanged since July 30 and the highest official reading in roughly a year (Freddie Mac PMMS, July 30, 2026). The next reading lands Thursday, August 6. Daily rate trackers have already pushed further out in front of that number: Fortune's tracker showed a 30-year jumbo rate near 6.89% on August 4, and NerdWallet described purchase quotes inching toward 7%, with a 30-year refinance average of 7.02%, the day before (Fortune; NerdWallet, August 3-4, 2026). None of that is the official benchmark, but it is close to what many lenders are quoting borrowers right now, and it is why so many buyers assume payments must be climbing too.
They are not. Not this week.
What actually fell, and why
Redfin's weekly housing market update for the period ending August 2 put the national median monthly housing payment at $2,598, the lowest level in six weeks. The same report pegged the four-week median US home-sale price at $408,808, down slightly from $409,388 the prior period but still up 2.2% year over year (Redfin, August 2, 2026). Price growth has essentially stalled at a record level, and sellers are doing the one thing that reliably lowers a buyer's monthly bill no matter what the rate does: cutting the price.
Run the math on a representative $350,000 loan and the mechanism becomes obvious. At 6.43%, the rate that prevailed for much of early July, principal and interest on that loan comes to $2,196 a month. At 6.66%, today's PMMS reading, the identical loan costs $2,249, a $53 increase for borrowing the exact same amount. That is the part rate headlines capture. What they miss is that a routine 2.3% price cut on a $350,000 listing, about $8,250 off the asking price, shrinks the loan amount enough to erase that entire $53 increase and then some. Sellers have been cutting prices at a near-record pace all summer, which is exactly why the national median payment can fall even while the rate that supposedly drives it keeps climbing.
Demand is softening at the same time, which reinforces the same story from the other direction. Mortgage applications fell 6.4% for the week ending July 24, with purchase applications down 3% and refinance applications down 10% (MBA, week ending July 24, 2026). Fewer buyers competing for the same homes gives sellers less room to hold their price, which is part of why the cuts keep coming.
This is not a one-week fluke either. Pending home sales fell 1.7% over the four weeks ending July 26, their lowest level since early April, even as the median payment kept easing (Redfin, July 30, 2026). Put the demand and payment trends side by side and a consistent picture emerges: buyers are pulling back at a rate that is still historically elevated, sellers are responding with real price concessions rather than waiting them out, and the net effect on your actual monthly bill has been more forgiving than the headline rate alone would suggest for most of the summer.
Get this in your inbox every Friday.
One email. The number that matters and what it means for you.
If you are waiting for the rate itself to drop before you write an offer, you may be watching the wrong number. This week's math says the price on the listing you actually want matters more to your monthly bill than another quarter point of rate movement you cannot control.
The rate that will not sit still
Freddie Mac's PMMS remains the number to anchor any rate-lock decision to, precisely because it is a weekly average survey rather than a single lender's daily quote. It has held at 6.66% for six days now, and Thursday's release will be the first official reading since the rate touched its highest point in a year. Daily trackers, by contrast, are compiled from live lender quotes and swing with bond-market sentiment hour to hour. The gap between the two has widened and narrowed repeatedly since early July, and this week it widened again: trackers ran as high as 6.89% to 7.02% on August 3 to 4 (Fortune; NerdWallet, August 3-4, 2026), a pattern that has now repeated itself at least half a dozen times since early July.
None of that day-to-day volatility should decide whether you lock today or wait a week. Your credit score does far more to set the rate you are actually quoted than a few basis points of daily noise, so if you have not checked what a stronger score could save you, the credit score mortgage myth is worth ten minutes more than another rate-tracker refresh this week.
Inventory just did something it has not done in months
National active listing growth had been decelerating almost every week since spring, sliding from 28.9% year-over-year growth a year ago down to just 1.9% by the end of June (ResiClub, June 30, 2026). This week's Redfin data shows that trend ticking up 0.5%, a small move, but the first sign in months that supply may be starting to respond to a rate environment that has kept plenty of would-be sellers on the sidelines (Redfin/ResiClub, week ending August 2, 2026). Total inventory nationally is still roughly 9.6% below where it stood in 2019, so this is a change in direction, not a flood of new listings.
The regional picture still varies widely, which matters if you are shopping outside your own metro. Florida's active inventory has actually edged down on a year-over-year basis after two years of being one of the softest markets in the country, while much of the Northeast and Midwest remain tight enough that sellers still hold the upper hand (ResiClub, 2026). A national uptick in listings does not mean every metro is suddenly buyer-friendly at the same pace, so check your specific market's own inventory trend before assuming this week's national number applies to the block you are actually shopping on.
More listings, even a modest uptick, mean more room to negotiate. If you have lost out on the two or three homes you actually wanted this year, a market that is finally adding supply instead of shrinking it works in your favor the longer you can afford to keep shopping.
What this means for your decision this week
Put the three data points together and the practical takeaway is not complicated. Rates are not falling, and nobody credible is forecasting a move back under 6% before year-end. Prices, on the other hand, are softening in exactly the way a market with rising inventory and record concessions should soften. The math points toward negotiating hard on price and closing costs rather than waiting on a rate drop the data does not support, and toward locking the rate you can get today rather than chasing a lower one that may not show up before your closing date.
You also do not need the 20% down payment many buyers still believe is required to act on this math now; the down payment myth has been costing buyers real money in appreciation and rent for years, and 3% down still qualifies for most conventional loans. Factor in the closing costs a seller in this market is often willing to help cover, and the case for acting on today's price rather than waiting on tomorrow's rate gets stronger, not weaker. If you already locked earlier this summer at a slightly lower rate, a float-down option was worth pricing out before your window closes; if you are locking today, ask your lender directly whether one is available, because the break-even math shifts every time the tracker-versus-PMMS gap widens like it did this week.
If you already own a home and are tracking a refinance instead of a purchase, the same tracker-versus-PMMS gap matters for a different reason: your break-even calculation should use the official 6.66% PMMS figure, not whichever daily quote you saw this morning, because that is the number your new payment will actually be built from once a lender locks it. A refinance that pencils out at 6.66% but not at 6.94% is not a coin flip; it is a math problem with a specific answer, and it is worth running before you assume this week's tracker spike changes anything about your own numbers.
Frankly, if you are sitting on a pre-approval and a target list of homes, this week's numbers argue for using it rather than waiting for a rate headline that flatters your patience. The sellers cutting prices right now are not waiting for the Fed either.