 Property
You've refinanced once already, locked in at 3.8%, and you've told yourself the rate conversation is over for you. What's left is the equity conversation, the quiet one you have with yourself every few months when you check your home's Zestimate and wonder whether you're close enough to 80% loan-to-value to finally drop PMI or open a cash-out refinance. This week that conversation just got more confusing, not less. The national median home price hit an all-time high. Before you get excited or dismiss it, you need to know whether that number has anything to do with your specific house.
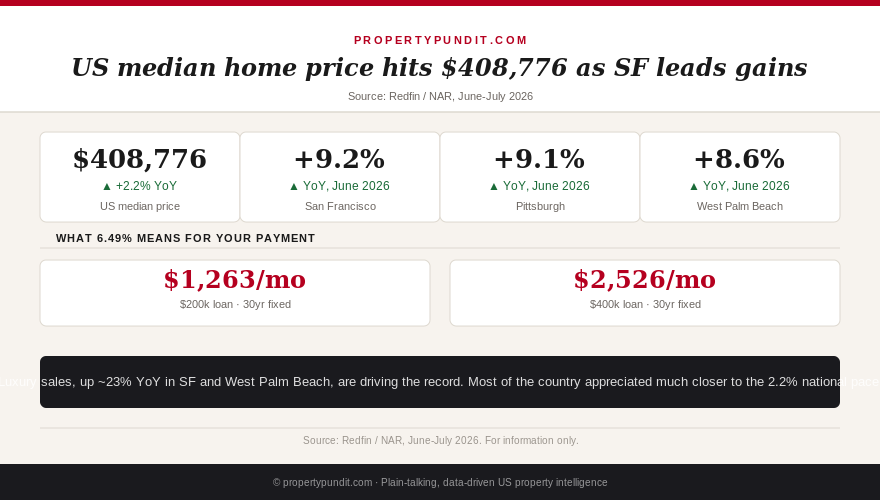
Redfin reported this week that the median US home-sale price rose to a record $408,776 in June 2026, up 2.2% from a year earlier (Redfin, July 13, 2026). The National Association of Realtors, which tracks existing-home sales only and uses a different, higher-priced sample, put its own June median at $440,600, up 1.8% year over year and the 36th straight month of annual gains (NAR, July 9, 2026). Both records are real. Neither tells you what happened to the specific house you live in.
The three cities doing the heavy lifting
Median sale prices rose faster in San Francisco, Pittsburgh, and West Palm Beach, Florida than in any other major US metro this June, up 9.2%, 9.1%, and 8.6% year over year respectively (Redfin, June 2026 data, released July 13, 2026). That is three to four times the national pace. Meanwhile, the broader housing market is still tilted toward buyers: active listings are up modestly year over year, seller concessions hit a record 46.2% of spring sales, and roughly 36% of listings carried a price cut in May (Redfin, NAR, 2026). A handful of expensive metros are quietly rewriting the national average while most of the country negotiates like it's a buyer's market, because for most sellers, it still is.
If you own in one of these three metros, or somewhere with a comparable profile, this week's data is not background noise. It's a direct signal to check your numbers now instead of waiting for your next annual statement.
Why San Francisco and West Palm Beach specifically
Redfin's own reporting ties the surge to luxury sales, not typical first-time or move-up buyers. Closed home sales in both San Francisco and West Palm Beach rose roughly 23% year over year, the largest increase of any major US metro tracked (Redfin, June 2026). Wealthier, often cash-heavy buyers are far less sensitive to a 6.49% mortgage rate than someone stretching to qualify at $78,000 or $112,000 in income, so they kept transacting even as the rest of the market cooled. Pittsburgh's 9.1% gain has a different driver: it's one of the last remaining lower-cost metros in the Northeast, and it has been climbing steadily for months as buyers priced out of Boston and New York corridors look for value. Either way, the common thread is that a small, specific slice of demand is pulling the national number upward, not a broad-based acceleration everywhere.
None of this changes what you should assume about your own street. A market moving on luxury demand or regional spillover doesn't automatically lift a median-income neighborhood two counties over, and treating a metro-wide average as your personal appreciation rate is exactly the kind of mistake that leads to a disappointing appraisal.
Get this in your inbox every Friday.
One email. The number that matters and what it means for you.
What this means if you already own
Here's the math that actually matters to you. Say your home was worth $500,000 a year ago. At the national pace of 2.2%, it's worth about $511,000 today, a gain of $11,000. At San Francisco's 9.2% pace, that same home would be worth roughly $546,000, a gain of $46,000. That $35,000 gap is the difference between still carrying PMI and having enough documented equity to request cancellation under the Homeowners Protection Act's 80% loan-to-value threshold this year instead of two or three years from now. Your lender is required to cancel PMI automatically at 78% LTV based on your original amortization schedule, but you can request it yourself at 80% with a current valuation in hand.
The only way to know which side of that gap you're on is to check your actual number, not the headline. Pull three to five recent comparable sales within a half-mile of your home from the last 90 days, or pay for a formal appraisal if you're planning to act on a refinance anyway. If your comps show 8% to 9% growth, you may already be sitting on enough equity to request PMI cancellation or explore a cash-out refinance despite rates still sitting at 6.49%. If your comps look closer to 2%, don't let this week's headline talk you into ordering an appraisal you don't need yet.
What this means if you're still trying to buy
If you're house hunting outside these three metros, this record is largely irrelevant to your negotiating position. Nationally, 4.6 months of supply, a 46.2% seller concession rate, and 36% of listings with price cuts all point toward a market where you still have real bargaining power to ask for closing cost credits, rate buydowns, or a straight price reduction (NAR, Redfin, 2026). If you're stretching to qualify at all, revisit the down payment math before assuming you need to wait out this cycle. The record median price is a story about where the wealthy are buying, not a signal that every seller in every ZIP code suddenly has the upper hand. Frankly, if a seller in a slower-moving metro tries to justify a firm asking price by pointing at this week's national headline, that's a bluff worth calling with your own comps.
The bottom line
Most people who see a record national price assume it applies evenly, and it almost never does. This week's data is a reminder that a national or even a citywide average is a starting point for a conversation with your lender or agent, not the final word on what your specific property is worth. Pull your own comps before you make any decision, whether that's requesting PMI cancellation, timing a cash-out refinance, or deciding how hard to negotiate on your next offer.
How to actually check your number this month
You don't need to pay for a full appraisal just to get a rough answer. Start with your county assessor's site, which often lists recent sale prices for your street and the surrounding few blocks; then cross-check against three to five closed sales, not active listings, from the last 90 days within a half-mile of your home, adjusting for square footage and condition. If those comps land near 8% or higher, that's a strong enough signal to justify the cost of a real appraisal or an automated valuation model from your lender. If they land closer to 2% to 3%, save the money and simply keep tracking your loan balance against your original purchase price for now.
One more thing worth checking before you call your lender: how much of your loan balance you've actually paid down. A homeowner two years into a 30-year mortgage has usually retired only a small share of the original principal, since early payments are weighted heavily toward interest. That means your path to 80% loan-to-value depends on both your appreciation rate and your amortization schedule together, not appreciation alone. Ask your servicer for your current payoff balance, divide it by your best current home value estimate, and you'll have the actual number that decides whether this week's headline is good news for you specifically or just an interesting story about someone else's ZIP code.