 Property
Every headline you've scrolled past this month says the same thing: it's finally a buyer's market. You're sitting on $78,000 a year in Atlanta, still doing math on a starter home, and you're wondering why it doesn't feel that way. Listings aren't sitting for months. Sellers aren't begging. You're still getting outbid on the handful of places in your range that don't need a new roof. If it's really a buyer's market, where's your bargaining power?
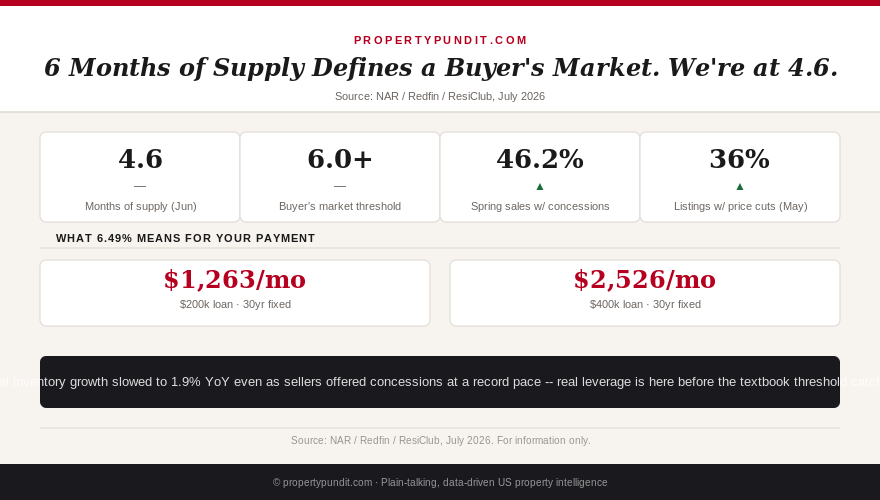
Here's the number nobody's putting next to that headline: national months of supply sat at 4.6 in June 2026 (NAR). The textbook definition of a buyer's market is 6 months of supply or more. We are not there. What's actually happening is more useful to understand than the "buyer's market" headline, and it changes how you should approach your next offer.
What "buyer's market" is actually supposed to mean
Months of supply measures how long it would take to sell every active listing at the current sales pace if zero new homes came on the market. Real estate professionals generally split the scale into three bands: under 3 to 4 months is a seller's market, where demand outpaces supply and buyers compete hard; 4 to 6 months is a balanced market, where neither side has a clear edge; and 6 months or more is a buyer's market, where sellers have to compete for buyers instead of the other way around. National inventory sitting at 4.6 months puts us squarely in the balanced zone, leaning toward sellers, not in true buyer's-market territory.
That distinction matters because it tells you the national headline is oversimplifying a market that's genuinely mixed. Knowing the real definition means you stop assuming every seller is desperate just because the news says buyers have the upper hand nationally.
So why does buyer bargaining power feel real anyway
Because it is real, just not for the reason the headlines imply. Seller concessions hit a record 46.2% of spring 2026 home sales (Redfin), the highest share since Redfin started tracking the metric in 2019. Nashville posted concessions on 75.5% of spring sales. National active listing growth has also been running ahead of a year ago, even as its year-over-year pace slowed to 1.9% by June 30 (ResiClub), and 36% of active listings carried a price cut in May (Realtor.com). None of that requires the national months-of-supply figure to cross 6. Concessions and price cuts are local, metro-by-metro and price-tier-by-price-tier decisions that individual sellers make when their specific listing sits too long, regardless of what the national average says.
For a buyer at $78,000 income, this is the gap that actually matters: the national number undersells how much room you have to ask for a rate buydown, a closing cost credit, or a repair allowance in a specific listing that's been sitting, even while the country as a whole is technically still in a balanced market. Check concessions and days-on-market for your target zip code before assuming the national label applies to the exact house you're bidding on.
It also explains why two buyers shopping the same metro can walk away with completely different read on the market. One agent tells you sellers are desperate; another says multiple offers are still common. Both can be right at once, because they're describing different listings inside the same 4.6-months-of-supply average, not different cities.
That's worth sitting with for a second, because it means the "is it a buyer's market" question is close to the wrong question. The right one is: how is this specific listing behaving, and what does that tell you about what the seller will actually accept.
Get this in your inbox every Friday.
One email. The number that matters and what it means for you.
Why the gap between the label and the upper hand exists
Inventory growth has been decelerating hard, from 28.9% year-over-year growth a year ago down to 1.9% by the end of June (ResiClub). At the same time, existing home sales fell 2.4% month over month in June even as the median price hit a record $440,600 (NAR), which tells you demand is soft too, not just supply. When both sides of the equation are pulling back at once, the national supply ratio can sit in balanced territory even while individual sellers, especially the ones who overpriced in spring or who need to move for a job, are negotiating like it's already a full buyer's market. That's not a contradiction. It's what happens in the transition zone between a seller's market and a buyer's market, which is exactly where the data says we are right now.
This also explains why your experience touring homes can feel inconsistent from one listing to the next. A well-priced starter home in a tight school district might still draw multiple offers in three days, while a similar home two neighborhoods over sits for six weeks and comes with an $8,000 credit attached. Both of those are true at the same time in a 4.6-months-of-supply market. Neither one tells you what the national label tells you.
What this means for your next offer
Frankly, if you're waiting for the national supply figure to cross 6 months before you start negotiating aggressively, you could be waiting years, and every month you wait costs you in rent and in whatever the median price does next. The math points toward evaluating each listing on its own terms instead: how many days has it been on market, has the price already been cut once, and what's the local concession rate for homes in your price band. Those three data points tell you more about your real bargaining power on a specific house than the national "buyer's market" headline ever will. Most people who run these numbers end up realizing the label is close to irrelevant to their actual negotiation, and the listing-specific signals are what should drive the offer, whether that means asking for a closing cost credit, a rate buydown, or simply holding firm on price instead of overpaying to compete for a home that hasn't drawn real interest from anyone else.
If you're stretching every dollar toward a down payment and trying to time this right, stop watching the national headline and start watching the listing. A home that's carried a price cut and sat 45-plus days in a market with 4.6 months of supply nationally is already behaving like a buyer's-market listing, whatever the textbook says about the country as a whole, and that's the signal worth acting on.