The housing market entered July at a standoff. Rates are stable, prices are at records, and buyers are hesitating — yet supply hasn't loosened enough to force prices down. Here are the five data points from the past seven days that matter most to your decisions this month.
Get this in your inbox every Friday.
One email. The number that matters and what it means for you.
1. Rate stability at 6.49% — the next reading is July 3
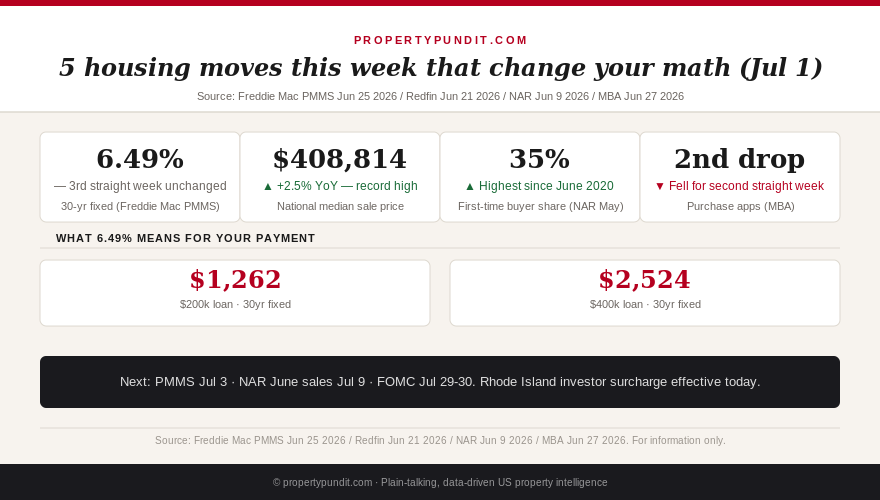
The stat: The 30-year fixed-rate mortgage averaged 6.49% for the third consecutive week, per the Freddie Mac PMMS reading for June 25, 2026. The 15-year fixed held at 5.84%.
Three weeks of stability at the same rate is itself a signal. The bond market has priced in the Fed's hawkish June 17 stance — no cuts before 2027, and a 68% probability of a December hike per CME FedWatch — and mortgage rates have essentially stopped reacting to new information. The spread between 30-year mortgages and the 10-year Treasury remains near 2.0 points, above the historical norm of 1.5 to 1.7. If that spread compressed to 1.7 without any Fed move, rates would fall to roughly 6.2% on the same Treasury yield.
The next PMMS reading is due July 3 — a shortened week before the July 4 holiday, which typically produces light volume and muted rate movement. Do not expect a meaningful move. The more important dates are July 9 (NAR June existing-home sales report) and July 30 (FOMC meeting). If you have a rate lock decision approaching, the framework from our rate lock vs. float guide still applies: lock if you're closing within 30 days, float with a defined trigger if you have 60 or more days of runway.
2. Record median price: $408,814 for the period ending June 21
The stat: The national median home sale price reached $408,814 for the four-week period ending June 21, 2026 — a record high and up 2.5% year over year (Redfin, June 2026). The NAR's separate measure, based on closed transactions through May 2026, pegged the median at $429,300 (up 1.3% year over year) — also a record for the month of May.
The divergence between a record median and weakening purchase activity is explained by composition. The homes that are transacting skew toward the mid-to-upper tier, where buyers are less sensitive to rate levels. Entry-level inventory remains thin, and the first-time buyer share — while recovering to 35% of May sales (NAR) — hasn't yet brought enough volume to normalize the median downward. For existing homeowners tracking their equity: this data suggests home values are holding. For first-time buyers: the math at today's prices and rates is as tight as it has been all year, and the rent-versus-buy breakeven calculation deserves a fresh look before you move.
3. Purchase applications fell for the second straight week
The stat: Mortgage purchase applications fell for the second consecutive week, with pending home sales also ticking down 0.1% week over week — the third straight week of slight declines from their May peak (Mortgage Bankers Association / HousingWire, week ending June 27, 2026).
Two weeks of declining purchase applications after a run-up through May is consistent with typical seasonal softening heading into summer, and the numbers are modest. But the context matters: buyers are not being priced out by rising rates (rates haven't moved). They're stepping back from a market where prices just hit a record and affordability hasn't improved. The average monthly housing payment nationally reached $2,647 in June 2026 — just $100 below the all-time high, per Redfin. If purchase apps continue falling through July, we'll see the downstream effect in August and September sales closings. That would be the first inventory-loosening signal in months, and it's worth watching.
4. First-time buyers at 35% of May sales — the highest since 2020
The stat: First-time buyers represented 35% of existing-home purchases in May 2026 — the highest share since June 2020 and up sharply from the 21% record low reported in NAR's 2025 annual survey (NAR, Existing-Home Sales June 9, 2026).
This is the best news in the May data for the broader market. When first-time buyers re-enter at scale, it activates the trade-up chain — entry-level buyers free existing owners to move up, which increases mid-tier supply. The 35% share is driven partly by softening competition at the low end (cash buyers down from their 2021-2022 peak, institutional purchasing down 90%+) and partly by pent-up demand from a generation that has been locked out for four years. The programs covering this — down payment assistance, FHA at 3.5% down, and the reinstated PMI deductibility under the OBBBA — are all playing a supporting role. If you're a first-time buyer sitting on the sidelines, there are more motivated sellers and fewer competing all-cash offers right now than at any point since 2019.
5. Rhode Island's new investor surcharge went live today
The stat: Rhode Island's non-owner-occupied property tax surcharge on properties assessed above $1 million took effect July 1, 2026, per Rhode Island General Assembly legislation. Long-term rental investors with written leases covering at least 183 days annually are exempt from the surcharge.
We covered the Rhode Island market in depth two weeks ago, including the full PITIA analysis that showed Providence investors losing $2,221/month at the $645k median. Today's effective date on the surcharge adds a layer: investors holding high-value Rhode Island properties without formal lease agreements — including those holding vacant or between-tenancy properties — now face additional carrying costs. If you own Rhode Island investment property assessed above $1M without a current lease on file, the exemption requires documentation. Contact your property manager or a Rhode Island real estate attorney to confirm your lease structure qualifies.
What to watch in July 2026
Three dates shape the housing calendar this month. The Freddie Mac PMMS on July 3 sets the rate baseline for the month; don't expect movement given the holiday-week context. July 9 brings the NAR June Existing-Home Sales report — the first data that will show whether May's buyer recovery continued into June or stalled in the face of rate stability. And July 30 is the FOMC meeting: the Fed is expected to hold at 3.50% to 3.75%, but the press conference statement on inflation and the rate hike probability will move bond yields more than the hold decision itself.
For buyers: the next 30 days are neither urgently better nor urgently worse than the past month. The case for acting before a potential December rate hike — which would add roughly $100 to $200 per month on a $350k loan — remains intact. But July data will clarify whether the May buyer recovery was sustainable or a brief window. Watch the July 9 NAR report closely.