You own two rental properties in Texas and you've been telling other investors about the no-income-tax advantage for years. The math felt obvious: zero state income tax versus the 4.5 to 9.9% bites taken by neighboring states. What you probably haven't modeled is what Texas's property tax does to that advantage once you actually run the PITIA numbers on a new acquisition today.
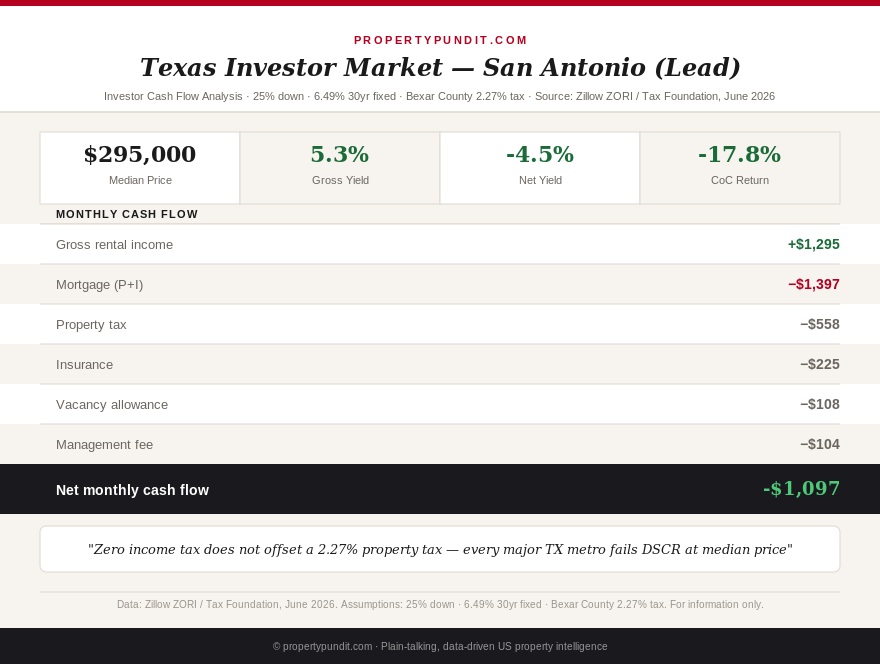
The answer, at the $295,000 San Antonio median, is that property tax alone adds $558 every month to your cost basis. At 25% down and today's 6.49% thirty-year rate (Freddie Mac PMMS, June 25, 2026), your PITI reaches $2,180 against average market rents of $1,295 per month. That is a $885 monthly deficit and a DSCR of 0.59 — far below the 1.25 threshold most portfolio lenders require for DSCR loan qualification.
Texas is the most marketed state in real estate investing content. This is the math behind the marketing.
Get this in your inbox every Friday.
One email. The number that matters and what it means for you.
The Texas property tax reality that no YouTube channel models
Texas has no state income tax — that part is accurate. It is also ranked seventh-highest nationally for property taxes and first among major Sun Belt states, with combined city, county, and school district rates running 2.0 to 2.3% depending on county (Tax Foundation, 2026). That combined rate applies equally to investor-owned and owner-occupied properties — unlike South Carolina, which charges investors 6% of fair market value against 4% for homeowners.
Here is what that rate means in monthly dollars across the four major Texas metros, using the most recent median home prices (Zillow ZHVI / Redfin, May-June 2026), 25% down, 6.49% thirty-year fixed rate, and Texas-representative insurance of $215 to $250 per month (elevated for hail and wind exposure):
San Antonio (Bexar County, 2.27% combined): Median $295,000. Loan $221,250. Monthly P&I: $1,397. Property tax: $558. Insurance: $225. PITI: $2,180. Average market rent: $1,295 (Zillow ZORI, June 2026). DSCR: 0.59. Monthly cash flow: -$885.
Houston (Harris County, 2.03% combined): Median $320,000. Loan $240,000. Monthly P&I: $1,515. Property tax: $541. Insurance: $250. PITI: $2,306. Average market rent: $1,650 (Zillow ZORI, June 2026). DSCR: 0.72. Monthly cash flow: -$656.
Dallas (Dallas County, 2.22% combined): Median $390,000. Loan $292,500. Monthly P&I: $1,847. Property tax: $722. Insurance: $240. PITI: $2,809. Average market rent: $1,900 (Zillow ZORI, June 2026). DSCR: 0.68. Monthly cash flow: -$909.
Fort Worth (Tarrant County, 2.10% combined): Median $325,000. Loan $243,750. Monthly P&I: $1,539. Property tax: $569. Insurance: $220. PITI: $2,328. Average market rent: $1,550 (Zillow ZORI, June 2026). DSCR: 0.67. Monthly cash flow: -$778.
Every major Texas metro fails the DSCR threshold at current rates and median entry prices. The income tax advantage does not factor into these numbers because DSCR is calculated on gross rental income, not net taxable income. Zero income tax does nothing for your DSCR — it only helps after the deal already cash flows. If the deal doesn't cash flow, the income tax benefit is irrelevant. That is the calculation most Texas investing content skips.
The counterintuitive California comparison
Here is a figure that stops most experienced investors cold: an investor buying a $295,000 property in California pays less in property tax per month than one buying the same property in Texas.
California's Proposition 13 caps the effective property tax rate at approximately 1.1 to 1.25% of purchase price for a new acquisition (resetting on purchase, then growing by no more than 2% annually). On a $295,000 California purchase, that is approximately $307 per month in property tax. The same property in San Antonio's Bexar County runs $558 per month — $251 more every month, or $3,012 more per year.
California does levy income tax at 9.3% on rental profit above $61,000 for most investors. On a hypothetical $12,000 annual rental profit, that is $1,116 per year, or $93 per month. The math: Texas pays $3,012 more in property taxes per year than California on the same $295k property, while saving $1,116 in income taxes. Texas investors end up $1,896 behind per year despite zero income tax.
This does not make California a better investor market. California's high prices, rent control laws, and tenant protections create separate structural challenges. The point is narrower: the "zero income tax" framing massively overstates the Texas advantage for most investors because it ignores the property tax offset. The net tax picture for a $295k Texas acquisition versus the same deal in an income-tax state is far closer than the zero-versus-9% comparison suggests.
For context on how Oklahoma — which has a 4.5% income tax — actually outperforms Texas on cash flow at the same price point due to a 0.92% property tax rate, see our Oklahoma investor analysis.
Austin: the correction that still hasn't fixed the math
Austin deserves a separate section because it attracts investor interest disproportionate to its fundamentals — and has for four years.
Austin area home prices have fallen approximately 4.6% over the past twelve months, making it the largest correction among major Texas metros. The median is now approximately $450,000 for the metropolitan area, down from a 2022 peak above $550,000. Rental rates have fallen 20% from their 2022 peak as apartment supply surged (Austin approved and built more new units per capita than almost any US metro during 2021 to 2023).
At $450,000 and 25% down, Austin's loan of $337,500 runs P&I of $2,130 per month at 6.49%. Travis County's combined property tax rate runs approximately 2.15%, adding $807 per month. Insurance adds $250 per month. Total PITI: $3,187 per month. Average Austin apartment rent: approximately $1,750 per month (Zillow ZORI, June 2026). DSCR: 0.55. Monthly loss: -$1,437.
The correction has helped appreciation-thesis buyers more than cash-flow investors. At current rates and rents, Austin produces the worst cash flow of any major Texas metro, despite the price decline. The rental supply overhang from the 2021 to 2023 construction boom will likely persist into 2027, limiting rent growth even as prices stabilize.
Where the Texas math actually works: sub-$190k near a military base
Texas has 15 major military installations, and the submarkets surrounding them are where investors can find transactions that approach break-even.
Joint Base San Antonio (JBSA) is the largest military complex in the world by population, with approximately 80,000 military personnel and civilian employees spread across Lackland, Fort Sam Houston, and Randolph. The Basic Allowance for Housing (BAH) for an E-4 with dependents at JBSA runs approximately $1,500 to $1,600 per month in 2026. BAH is paid directly by the military and does not depend on the tenant's job security — making it one of the most reliable rent sources available to any landlord.
At a $185,000 acquisition price in a JBSA-adjacent neighborhood (Converse, Universal City, Live Oak), with 30% down: loan of $129,500, P&I of $818 per month, property tax at 2.27% adding $350 per month, and insurance of $160 per month. Total PITI: $1,328 per month. With BAH-backed rent at $1,500 per month, monthly gross margin is $172 before management and vacancy. After 8% management ($120) and 5% vacancy allowance ($75), net cash flow is approximately -$23 per month — near breakeven.
That is with 30% down, not 25%. At 25% down, the same $185k property runs P&I of $876 per month and DSCR of 1.02 — technically clearing the minimum 1.0 floor but below the 1.25 most portfolio lenders want for full DSCR loan approval at competitive rates.
Other viable sub-markets: NAS Corpus Christi (Corpus Christi Bay area, median SFR sub-$200k, DSCR approaching 1.0 with BAH support); Dyess AFB in Abilene (median sub-$185k, lower insurance exposure inland, DSCR 1.04 to 1.09 with local rents); and Goodfellow AFB in San Angelo (median sub-$175k, small but stable military rental base).
None of these produce the cash-on-cash returns available in Oklahoma at $264k, Indiana at $185k, or Tennessee's Memphis market at sub-$155k. Texas military-market investing is a cash flow preservation strategy, not a cash flow generation strategy. The income tax advantage does help at the margin once depreciation and deductions are applied — but that argument only holds if the underlying deal breaks even before tax treatment, which most Texas markets don't.
The Sun Belt vacancy problem compounding the Texas picture
Texas's major metros are among the most heavily supplied rental markets in the country. Houston vacancy ran 19.5% in early 2026. Dallas vacancy was at 18%. Austin was at 16.7% (versus 7.2% nationally), driven by the apartment construction surge of 2021 to 2023 (Zillow Research, May 2026).
Vacancy rates at these levels mean two things for investors entering now: achievable rents are lower than peak ZORI figures suggest (landlords in oversupplied markets offer concessions to fill units), and the time to stabilize a new acquisition is longer than in tighter markets. If you underwrite a Dallas deal at $1,900 per month and it takes 45 days to lease at $1,750, the annual effective rent is $1,640 — not $1,900. At $1,640, the Houston DSCR falls from 0.72 to 0.71, which doesn't matter because it was already failing, but it illustrates how vacancy adjustments widen losses in these markets.
The Sun Belt vacancy overhang is a 12 to 18 month story. As the 2021 to 2023 apartment supply is absorbed, vacancy rates should normalize toward 7 to 9%. The investors who enter Texas markets in 2026 and 2027 at today's distressed rent assumptions may be positioned well for the 2028 rent recovery. That is an appreciation and rent-growth thesis, not a cash flow thesis — and it requires carrying months of negative cash flow while waiting for the cycle to turn.
For a broader view of how Sun Belt rent corrections feed into home price pressure over time, our Sun Belt rent decline analysis breaks down the mechanics.
The honest Texas investor profile: what type of buyer this actually suits
Texas makes sense for a narrow investor profile: someone with significant equity capital (30%+ down payment, or cash), a long holding horizon (five to ten years minimum), a preference for appreciation over cash flow, and either a direct connection to the military rental tenant base or a strong local property management relationship.
For an investor with two existing properties and a 25% down payment, entering Texas's major metros at current rates and prices will produce monthly losses of $650 to $900 until rates fall significantly or rents recover. The income tax savings on near-zero net rental income are minimal. The exit thesis depends on appreciation — which Texas delivered from 2020 to 2022 and then gave most back.
The math points toward this: if you want cash flow from a new Texas acquisition at 6.49% rates, you need to be in a specific submarket (near a military base), at a specific price point (sub-$190k), with a specific down payment (30%), and patience for near-zero returns while the rental market recovers. If those conditions fit your portfolio, there are deals to be done. If you need the property to cash flow from month one, Texas is not the right state right now — despite every podcast's insistence otherwise.
For a county-level comparison of SFR yields across the full US investor landscape, see our SFR yield county map. For the comparison of Dallas and San Antonio from a first-time buyer's perspective, our Dallas vs San Antonio affordability analysis shows why the $295k San Antonio median works for buyers at $112k income even when it fails for investors.