Your fixed rate is ticking. You bought or last refinanced in 2022 or 2023, and you've been watching the 30-year rate the same way you watch a slow countdown clock, knowing it needs to drop before the math works, but not knowing when that happens. The June data has something to say about your timeline. Not everything you'd hope for, and not as simple as "rates are falling soon," but specific enough to make the next 60 days a genuine decision point.
Here are the five numbers worth understanding this week, and what each one means for the refi decision you're sitting on.
Get this in your inbox every Friday.
One email. The number that matters and what it means for you.
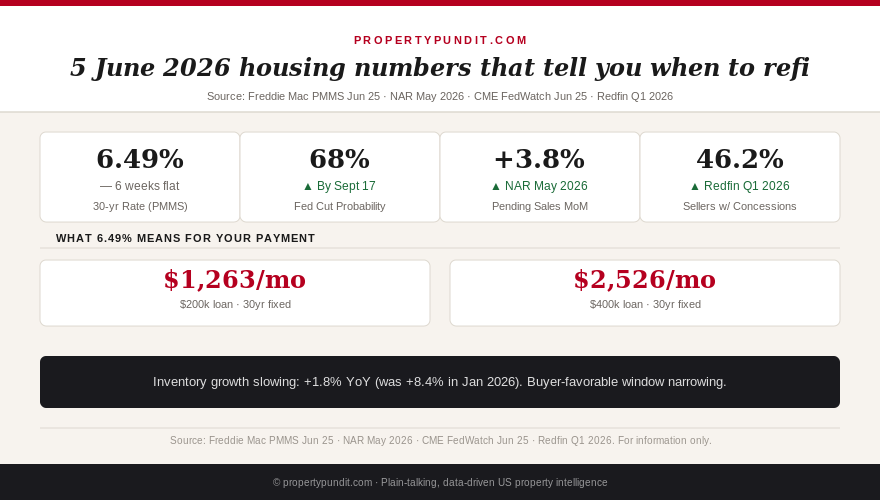
The Freddie Mac Primary Mortgage Market Survey published June 25, 2026 put the national average 30-year fixed rate at 6.49%. That number, or one within a few basis points of it, has held since mid-May. Six weeks at the same level is not normal rate behavior, the 30-year typically moves 10-20 basis points in either direction over any six-week window in a non-crisis environment.
What this plateau means is that the rate environment is not actively working against you right now, but it is also not signaling the near-term drop that would make a refi straightforward. The most-watched mortgage rate benchmark has effectively paused while the market waits for the Federal Reserve to signal its next move. The June 18 Fed meeting left the federal funds rate unchanged at 4.25%-4.50% for the fourth consecutive meeting, reiterating its "data-dependent" stance. The PMMS rate reflects that stalemate.
The historical pattern from the 2018-2019 rate cycle is instructive: in both cases where the Fed paused for 3+ meetings before cutting, mortgage rates began to fall 6-8 weeks before the first actual cut, as bond markets priced in the probability ahead of the announcement. If that pattern holds, a rate plateau now, with market expectations for a September cut, could produce mortgage rate movement as early as late July or August.
As of June 25, 2026, the CME FedWatch Tool showed a 68% probability of at least one 25-basis-point rate cut by the September 17 Federal Open Market Committee meeting. That's up from 54% a month ago. The shift reflects incoming data: May CPI came in at 2.4% year-over-year, its third consecutive monthly print below 2.5%; the May jobs report showed 138,000 new nonfarm payroll jobs, below the 150,000 consensus and the lowest monthly total since Q3 2024.
It's important to understand what a 25-basis-point fed funds cut does, and does not, do to your mortgage rate. The federal funds rate is an overnight lending rate between banks, not directly linked to 30-year mortgage rates. Mortgage rates track 10-year Treasury yields, which are driven by long-term inflation expectations, not short-term Fed policy. A 25bp cut by itself might move the 30-year mortgage rate 5-15 basis points, not 50. If the cut signals the beginning of a sustained easing cycle, bond markets will price in additional future cuts, and that's where the larger mortgage rate move would come from.
In the 2019 easing cycle, the first cut (July 31, 2019) was followed by a cumulative 75bp reduction in the mortgage rate over the subsequent 6 months, three cuts in total, pulling the 30-year from roughly 3.9% to 3.6%. A similar pattern today, starting from 6.49%, implies a potential landing zone around 6.0%-6.1% by Q1 2027 if the easing cycle goes three cuts deep.
The NAR's Pending Home Sales Index for May 2026 rose 3.8% month-over-month, the largest single-month gain since October 2024. Pending sales measure signed purchase contracts, not closed transactions, which makes them a leading indicator for closed sales 1-2 months out. A 3.8% gain signals that buyer demand is building, even at current rates.
The context matters: this comes after a period of very weak spring activity. Pending sales were down 8.6% year-over-year through March 2026 as buyers waited for rate relief. The May rebound suggests that some segment of sidelined demand is re-entering the market, not because rates are lower, but because buyers are adjusting their expectations. This is what's sometimes called "rate fatigue": buyers who have been waiting for 5.5% deciding that 6.49% is as good as they're likely to see in the near term and moving forward anyway.
The downstream effect on the rate environment is worth noting. When buyer demand increases, more mortgage applications flow through lenders, which can add marginal upward pressure on rates. A meaningful reacceleration in demand, pending sales up 5%+ for two consecutive months, historically tightens the rate environment, not loosens it. The pending sales signal is good for housing market health but cuts against the narrative that rates will drop quickly and smoothly.
Redfin's Q1 2026 data showed that 46.2% of home sellers nationally offered concessions to buyers, up from 41.8% in Q1 2025. Concessions include seller-paid closing costs, mortgage rate buydowns (the seller pays points to reduce the buyer's rate), repair credits, and HOA dues prepayment. The 46.2% figure is the highest share since Redfin began tracking concessions in this form.
The most valuable concession for rate-anxious buyers right now is the 2-1 buydown. This is a seller-funded arrangement where the buyer's rate is 2% below the note rate in year one and 1% below in year two. On a $400,000 home with a 6.49% market rate, a seller-funded 2-1 buydown means the buyer pays 4.49% in year one and 5.49% in year two before settling at 6.49% in year three. The cost to the seller is approximately $7,500-$9,000 upfront. For buyers, it means two years of meaningfully lower payments while rates, potentially, fall to where a refinance makes sense.
The 46.2% concession rate is a data point about seller urgency. When sellers are paying to buy down your rate or cover your closing costs, they're competing for your offer in a market that hasn't fully recovered demand. That's a negotiating environment. It won't last indefinitely, the pending sales data above suggests demand is recovering, but it exists right now.
Redfin's active listing data for the week ending June 21, 2026 showed year-over-year inventory growth at +1.8%, down from +8.4% year-over-year in January 2026 and the third consecutive month of decelerating supply growth. At the beginning of 2026, the narrative was that inventory normalization was shifting negotiating power to buyers. The pace of that normalization is now clearly slowing.
The cause is what analysts have been calling the "rate lock-in effect", homeowners who refinanced at 2.75%-3.5% in 2020 and 2021 and have no financial incentive to sell and give up those rates. The net effect is a market that can't fully restock, because existing owners won't list. New construction has partially compensated: new home inventory is up 11% year-over-year, but new builds represent only 12-15% of total transactions and are concentrated in a subset of markets (Sun Belt metros, outer-ring suburbs with available land).
The inventory deceleration matters for buyers because it directly affects your negotiating position. When inventory was growing at 8% year-over-year, you had more options, slower competition, and higher concession rates. At 1.8% growth, that advantage is narrowing. In tight markets (Northeast, West Coast, high-demand Sun Belt metros), active inventory is already flat or declining on a year-over-year basis.
What these five numbers say together
Read in isolation, each of these numbers has an obvious interpretation. Read together, they describe a market at an inflection point. Rates are stable but not falling yet. Rate cut probability is rising but not certain. Demand is recovering from a weak spring. Seller negotiating power is eroding (the concession rate tells you this). Inventory growth is decelerating, which means the buyer-favorable environment has a shorter shelf life than it appeared in January.
The most actionable version of this picture is for anyone sitting on a 2022 or 2023 mortgage rate who has been waiting to refinance. The window for patience is 3-6 months, not 12-18. If September brings a rate cut and mortgage rates move down to the 6.0%-6.15% range, the break-even period on a refinance from 7.0%-7.5% drops below 24 months for most loan balances. That's a reasonable risk to take. If the easing cycle stalls, if inflation re-accelerates or the September cut gets pushed to December, you've waited and rates haven't moved.
The math points toward preparing now, not acting now. Get current lender quotes. Understand your break-even calculation. Know what rate you need to see to make the refinance worth it. When rates move, the window for closing a refi at a new rate is short, lenders reprice quickly in a declining rate environment because demand spikes and capacity gets constrained. The people who close quickly after a rate drop are the ones who already did the paperwork.
If you haven't calculated your specific refi break-even yet, the refinance trigger analysis and the mortgage calculator are the place to start. The number you need is not "what is today's rate?" but "at what rate does my monthly savings pay back my closing costs in less than 24 months?" That number is personal. Everything else is noise.